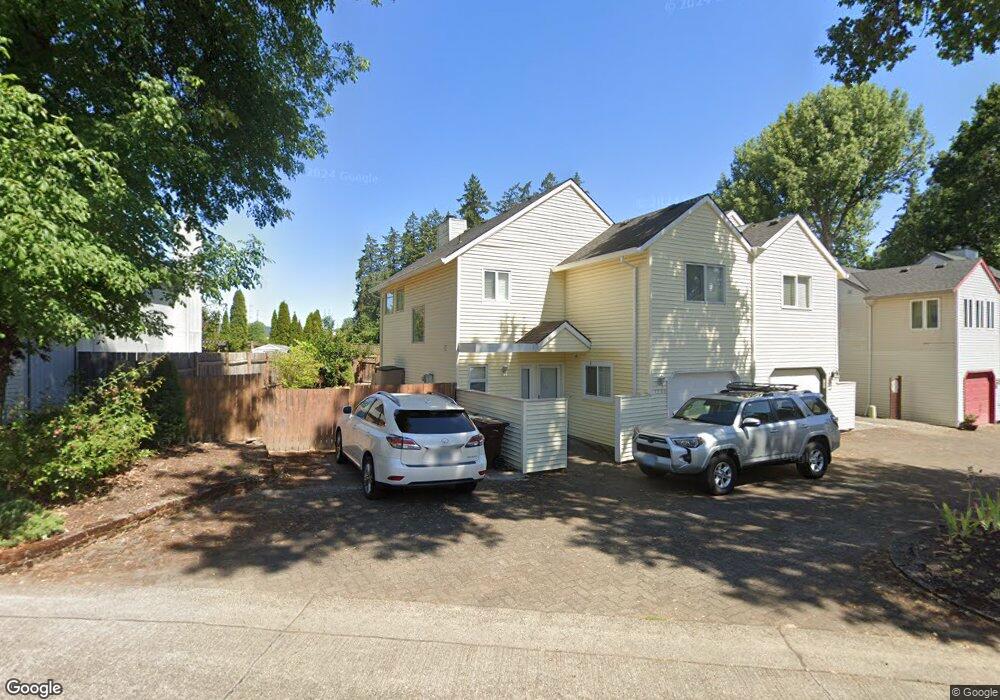
1208 NW Weybridge Way Beaverton, OR 97006
Five Oaks NeighborhoodEstimated Value: $416,000 - $530,000
2
Beds
7
Baths
1,482
Sq Ft
$326/Sq Ft
Est. Value
About This Home
This home is located at 1208 NW Weybridge Way, Beaverton, OR 97006 and is currently estimated at $482,773, approximately $325 per square foot. 1208 NW Weybridge Way is a home located in Washington County with nearby schools including Elmonica Elementary School, Five Oaks Middle School, and Westview High School.
Ownership History
Date
Name
Owned For
Owner Type
Purchase Details
Closed on
Sep 23, 2020
Sold by
Finley David E
Bought by
Finley Soon Im
Current Estimated Value
Purchase Details
Closed on
Jul 3, 2006
Sold by
Kobernik Jeffrey A and Kobernik Cara J
Bought by
Finley David E and Finley David E
Home Financials for this Owner
Home Financials are based on the most recent Mortgage that was taken out on this home.
Original Mortgage
$176,500
Interest Rate
6.66%
Mortgage Type
Unknown
Purchase Details
Closed on
Jun 27, 2002
Sold by
Sears Debra A
Bought by
Kobernik Jeffrey A and Kobernik Cara J
Home Financials for this Owner
Home Financials are based on the most recent Mortgage that was taken out on this home.
Original Mortgage
$160,481
Interest Rate
6.78%
Mortgage Type
FHA
Purchase Details
Closed on
Dec 13, 1999
Sold by
Brodie Kathie
Bought by
Sears Debra A
Home Financials for this Owner
Home Financials are based on the most recent Mortgage that was taken out on this home.
Original Mortgage
$130,500
Interest Rate
7.96%
Create a Home Valuation Report for This Property
The Home Valuation Report is an in-depth analysis detailing your home's value as well as a comparison with similar homes in the area
Home Values in the Area
Average Home Value in this Area
Purchase History
| Date | Buyer | Sale Price | Title Company |
|---|---|---|---|
| Finley Soon Im | -- | None Available | |
| Finley David E | $240,000 | Transnation Title Agency Or | |
| Kobernik Jeffrey A | $163,000 | First American Title Ins Co | |
| Sears Debra A | $145,000 | First American Title Co |
Source: Public Records
Mortgage History
| Date | Status | Borrower | Loan Amount |
|---|---|---|---|
| Previous Owner | Finley David E | $176,500 | |
| Previous Owner | Kobernik Jeffrey A | $160,481 | |
| Previous Owner | Sears Debra A | $130,500 |
Source: Public Records
Tax History Compared to Growth
Tax History
| Year | Tax Paid | Tax Assessment Tax Assessment Total Assessment is a certain percentage of the fair market value that is determined by local assessors to be the total taxable value of land and additions on the property. | Land | Improvement |
|---|---|---|---|---|
| 2026 | $5,464 | $266,740 | -- | -- |
| 2025 | $5,464 | $258,980 | -- | -- |
| 2024 | $5,159 | $251,440 | -- | -- |
| 2023 | $5,159 | $244,120 | $0 | $0 |
| 2022 | $4,937 | $244,120 | $0 | $0 |
| 2021 | $4,765 | $230,110 | $0 | $0 |
| 2020 | $4,620 | $223,410 | $0 | $0 |
| 2019 | $4,474 | $216,910 | $0 | $0 |
| 2018 | $4,331 | $210,600 | $0 | $0 |
| 2017 | $4,169 | $204,470 | $0 | $0 |
| 2016 | $4,024 | $198,520 | $0 | $0 |
| 2015 | $3,875 | $192,740 | $0 | $0 |
| 2014 | $3,792 | $187,130 | $0 | $0 |
Source: Public Records
Map
Nearby Homes
- 1630 NW Eastbrook Ct Unit 439
- 17525 NW Shorewood Dr Unit 487
- 17555 NW Shorewood Dr Unit 497
- 1551 NW Tanasbrook Ct
- 17570 NW Shorewood Dr
- 17756 NW Lakeway Ct Unit 294
- 17822 NW Lakeway Ct
- 1696 NW Rolling Hill Dr Unit 348C
- 17925 NW Waterfield Ct
- 1785 NW Rolling Hill Dr
- 17760 NW Rolling Hill Ln Unit 399
- 415 NW Kotrik Place
- 17980 NW Rapid St
- 1718 NW Midlake Ln Unit B227
- 1574 NW Bridgeway Ln Unit A37
- 1614 NW Bridgeway Ln Unit A33
- 17629 NW Shady Fir Loop
- 17808 NW Pioneer Rd
- 17621 NW Shady Fir Loop Unit 65
- 16223 NW Ashfield Dr
- 1204 NW Weybridge Way
- 1212 NW Weybridge Way
- 1200 NW Weybridge Way
- 1196 NW Weybridge Way
- 1207 NW Weybridge Way
- 1216 NW Weybridge Way
- 1211 NW Weybridge Way
- 1192 NW Weybridge Way
- 1217 NW Weybridge Way
- 1188 NW Weybridge Way
- 1185 NW Weybridge Way
- 1220 NW Weybridge Way
- 1229 NW Weybridge Way
- 1184 NW Weybridge Way
- 1179 NW Weybridge Way
- 1224 NW Weybridge Way
- 1241 NW Weybridge Way
- 1180 NW Weybridge Way
- 1173 NW Weybridge Way
- 1236 NW Weybridge Way