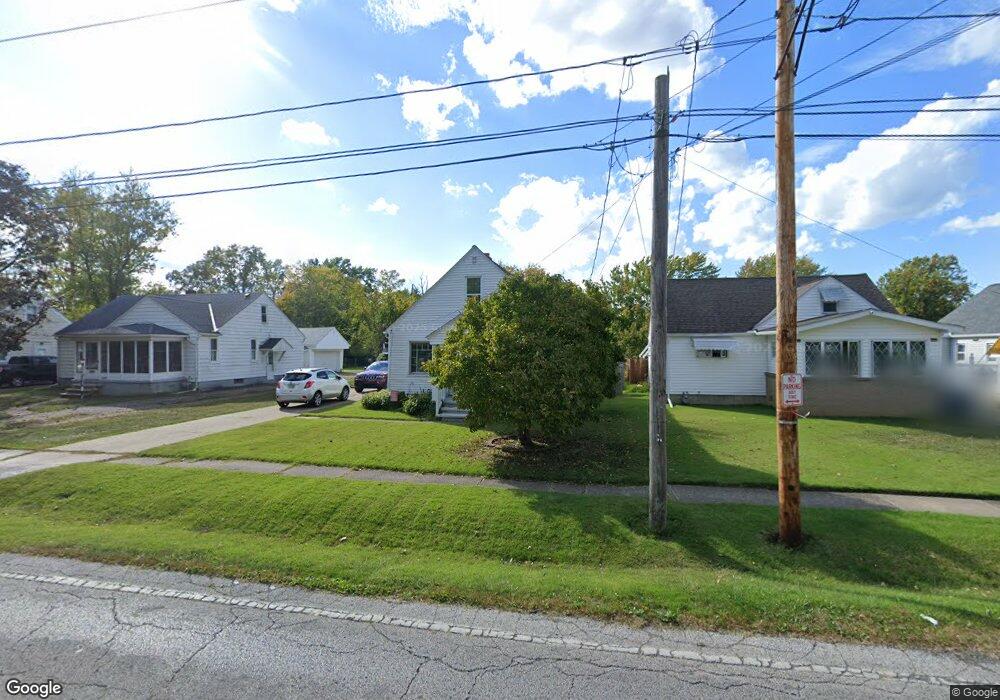
1208 Root Rd Lorain, OH 44052
Estimated Value: $74,000 - $147,000
3
Beds
1
Bath
1,066
Sq Ft
$113/Sq Ft
Est. Value
About This Home
This home is located at 1208 Root Rd, Lorain, OH 44052 and is currently estimated at $120,117, approximately $112 per square foot. 1208 Root Rd is a home located in Lorain County with nearby schools including Larkmoor Elementary School, Longfellow Middle School, and Lorain High School.
Ownership History
Date
Name
Owned For
Owner Type
Purchase Details
Closed on
May 8, 2025
Sold by
Garza Lucia and Garza Karl Margaret
Bought by
Revived Homes Llc
Current Estimated Value
Purchase Details
Closed on
Sep 15, 2009
Sold by
Garza Lucia
Bought by
Revived Homes and Yagielo Theresa Riddell
Home Financials for this Owner
Home Financials are based on the most recent Mortgage that was taken out on this home.
Original Mortgage
$71,441
Interest Rate
5.32%
Mortgage Type
Seller Take Back
Purchase Details
Closed on
Dec 7, 2000
Sold by
Stevenson Mark and Stevenson Elaine
Bought by
Garza Lucia
Home Financials for this Owner
Home Financials are based on the most recent Mortgage that was taken out on this home.
Original Mortgage
$81,442
Interest Rate
7.7%
Mortgage Type
FHA
Purchase Details
Closed on
Jul 9, 1996
Sold by
Kozlowski Peter J
Bought by
Kozlowski Mark and Kozlowski Anita
Home Financials for this Owner
Home Financials are based on the most recent Mortgage that was taken out on this home.
Original Mortgage
$51,750
Interest Rate
8.07%
Mortgage Type
New Conventional
Create a Home Valuation Report for This Property
The Home Valuation Report is an in-depth analysis detailing your home's value as well as a comparison with similar homes in the area
Home Values in the Area
Average Home Value in this Area
Purchase History
| Date | Buyer | Sale Price | Title Company |
|---|---|---|---|
| Revived Homes Llc | $71,500 | None Listed On Document | |
| Revived Homes | $71,441 | None Available | |
| Garza Lucia | $81,500 | Midland Title | |
| Kozlowski Mark | $51,750 | -- |
Source: Public Records
Mortgage History
| Date | Status | Borrower | Loan Amount |
|---|---|---|---|
| Previous Owner | Revived Homes | $71,441 | |
| Previous Owner | Garza Lucia | $81,442 | |
| Previous Owner | Kozlowski Mark | $51,750 |
Source: Public Records
Tax History
| Year | Tax Paid | Tax Assessment Tax Assessment Total Assessment is a certain percentage of the fair market value that is determined by local assessors to be the total taxable value of land and additions on the property. | Land | Improvement |
|---|---|---|---|---|
| 2024 | $1,475 | $34,913 | $4,585 | $30,328 |
| 2023 | $1,286 | $24,346 | $4,368 | $19,978 |
| 2022 | $1,276 | $24,346 | $4,368 | $19,978 |
| 2021 | $1,275 | $24,346 | $4,368 | $19,978 |
| 2020 | $1,218 | $20,190 | $3,620 | $16,570 |
| 2019 | $1,211 | $20,190 | $3,620 | $16,570 |
| 2018 | $1,211 | $20,190 | $3,620 | $16,570 |
| 2017 | $1,298 | $20,400 | $3,960 | $16,440 |
| 2016 | $1,288 | $20,400 | $3,960 | $16,440 |
| 2015 | $1,184 | $20,400 | $3,960 | $16,440 |
| 2014 | $1,125 | $19,430 | $3,770 | $15,660 |
| 2013 | $1,116 | $19,430 | $3,770 | $15,660 |
Source: Public Records
Map
Nearby Homes
- 0 Root Rd
- 1001 Euclid Ave
- 1008 Euclid Ave
- 3145 G St
- 1007 Leroy St
- 512 Euclid Ave
- 502 Euclid Ave
- 0 Eastlawn St Unit 5106705
- 2867 Garfield Blvd
- 1622 New Jersey Ave
- 1506 Nevada Ave
- 0 Colorado Ave
- 235 Euclid Ave
- 2967 Cleveland Blvd
- 2737 N Jefferson Blvd
- 2240 Jackson St
- 3031 E Erie Ave
- 2235 Crehore St
- 2630 E Erie Ave
- 2201 Eastlawn St
Your Personal Tour Guide
Ask me questions while you tour the home.