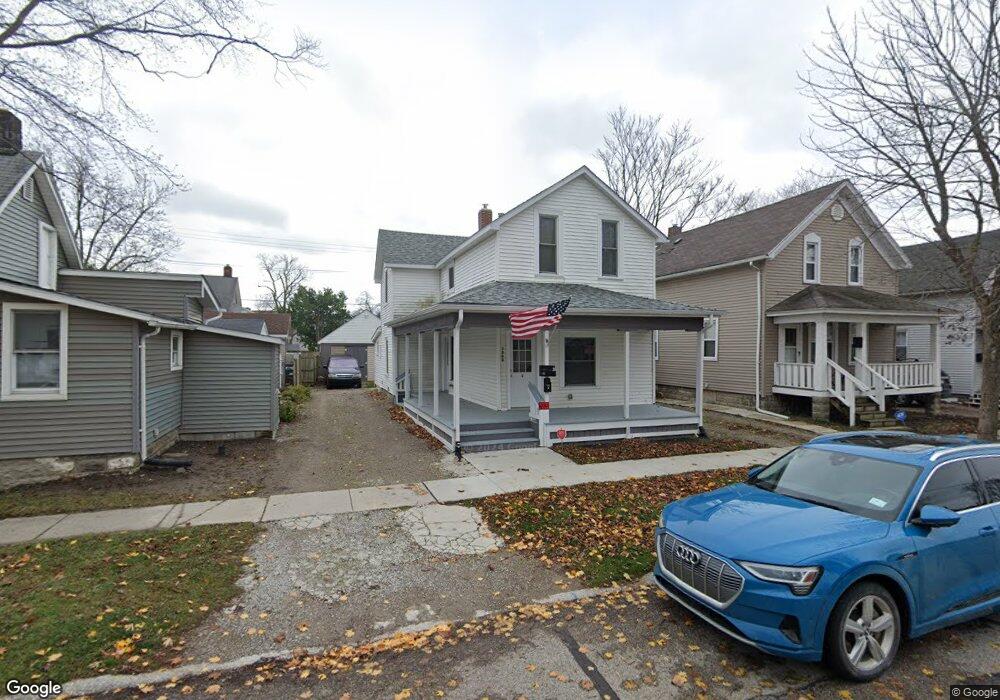
1208 Ward St Port Huron, MI 48060
Estimated Value: $123,000 - $147,000
3
Beds
2
Baths
1,336
Sq Ft
$102/Sq Ft
Est. Value
About This Home
This home is located at 1208 Ward St, Port Huron, MI 48060 and is currently estimated at $136,537, approximately $102 per square foot. 1208 Ward St is a home located in St. Clair County with nearby schools including Woodrow Wilson Elementary School, Holland Woods Middle School, and Port Huron High School.
Ownership History
Date
Name
Owned For
Owner Type
Purchase Details
Closed on
Jan 4, 2016
Sold by
Marzolf Timothy J
Bought by
Parmann Edward J
Current Estimated Value
Purchase Details
Closed on
Apr 15, 2011
Sold by
Westwood Investments & Management Llc
Bought by
Marzolf Imothy J
Purchase Details
Closed on
Nov 8, 2005
Sold by
Marzolf Timothy L
Bought by
Westwood Investments And Management Llc
Purchase Details
Closed on
Jul 29, 1996
Sold by
Schock Gerald E and Schock Marianne
Bought by
Marzolf Richard R
Create a Home Valuation Report for This Property
The Home Valuation Report is an in-depth analysis detailing your home's value as well as a comparison with similar homes in the area
Home Values in the Area
Average Home Value in this Area
Purchase History
| Date | Buyer | Sale Price | Title Company |
|---|---|---|---|
| Parmann Edward J | -- | None Available | |
| Marzolf Imothy J | -- | None Available | |
| Westwood Investments And Management Llc | -- | None Available | |
| Marzolf Richard R | $10,500 | None Available | |
| Marzolf Richard R | $10,500 | None Available |
Source: Public Records
Tax History Compared to Growth
Tax History
| Year | Tax Paid | Tax Assessment Tax Assessment Total Assessment is a certain percentage of the fair market value that is determined by local assessors to be the total taxable value of land and additions on the property. | Land | Improvement |
|---|---|---|---|---|
| 2025 | $2,095 | $55,900 | $0 | $0 |
| 2024 | $1,826 | $50,100 | $0 | $0 |
| 2023 | $1,729 | $43,600 | $0 | $0 |
| 2022 | $1,721 | $36,800 | $0 | $0 |
| 2021 | $1,512 | $30,900 | $0 | $0 |
| 2020 | $1,518 | $29,100 | $29,100 | $0 |
| 2019 | $1,491 | $21,100 | $0 | $0 |
| 2018 | $1,457 | $21,100 | $0 | $0 |
| 2017 | $1,205 | $19,800 | $0 | $0 |
| 2016 | $1,066 | $19,800 | $0 | $0 |
| 2015 | $1,142 | $20,400 | $20,400 | $0 |
| 2014 | $1,142 | $21,200 | $21,200 | $0 |
| 2013 | -- | $21,200 | $0 | $0 |
Source: Public Records
Map
Nearby Homes