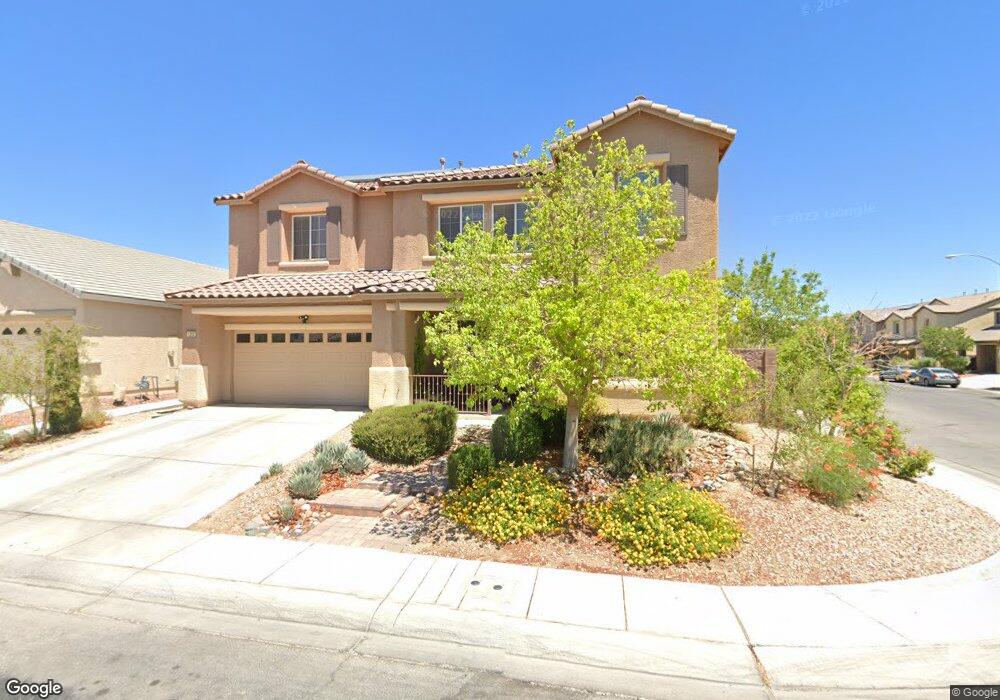
1208 Windy Ferrell Ave North Las Vegas, NV 89081
Northridge NeighborhoodEstimated Value: $492,036 - $501,000
4
Beds
3
Baths
2,708
Sq Ft
$184/Sq Ft
Est. Value
About This Home
This home is located at 1208 Windy Ferrell Ave, North Las Vegas, NV 89081 and is currently estimated at $497,009, approximately $183 per square foot. 1208 Windy Ferrell Ave is a home located in Clark County with nearby schools including Jesse D. Scott Elementary School, Clifford O. Findlay Middle School, and Mojave High School.
Ownership History
Date
Name
Owned For
Owner Type
Purchase Details
Closed on
Mar 31, 2009
Sold by
Aurora Loan Services Llc
Bought by
Villa Martin and Devilla Olga Andrade
Current Estimated Value
Home Financials for this Owner
Home Financials are based on the most recent Mortgage that was taken out on this home.
Original Mortgage
$155,138
Outstanding Balance
$99,277
Interest Rate
5.17%
Mortgage Type
FHA
Estimated Equity
$397,732
Purchase Details
Closed on
Sep 29, 2008
Sold by
Gomez Moises Cerda
Bought by
Aurora Loan Services Llc
Purchase Details
Closed on
Aug 22, 2006
Sold by
Us Home Corp
Bought by
Gomez Moises Cerda
Home Financials for this Owner
Home Financials are based on the most recent Mortgage that was taken out on this home.
Original Mortgage
$292,400
Interest Rate
7.87%
Mortgage Type
Unknown
Purchase Details
Closed on
Feb 6, 2006
Sold by
Celebrate Holdings Llc
Bought by
Us Home Corp
Create a Home Valuation Report for This Property
The Home Valuation Report is an in-depth analysis detailing your home's value as well as a comparison with similar homes in the area
Home Values in the Area
Average Home Value in this Area
Purchase History
| Date | Buyer | Sale Price | Title Company |
|---|---|---|---|
| Villa Martin | $158,000 | Noble Title | |
| Aurora Loan Services Llc | $224,100 | Fidelity National | |
| Gomez Moises Cerda | $324,990 | North American Title Co | |
| Us Home Corp | $2,867,652 | North American Title Co |
Source: Public Records
Mortgage History
| Date | Status | Borrower | Loan Amount |
|---|---|---|---|
| Open | Villa Martin | $155,138 | |
| Previous Owner | Gomez Moises Cerda | $292,400 |
Source: Public Records
Tax History Compared to Growth
Tax History
| Year | Tax Paid | Tax Assessment Tax Assessment Total Assessment is a certain percentage of the fair market value that is determined by local assessors to be the total taxable value of land and additions on the property. | Land | Improvement |
|---|---|---|---|---|
| 2025 | $3,092 | $153,045 | $38,850 | $114,195 |
| 2024 | $2,864 | $153,045 | $38,850 | $114,195 |
| 2023 | $2,864 | $146,172 | $36,400 | $109,772 |
| 2022 | $2,652 | $128,795 | $28,700 | $100,095 |
| 2021 | $2,456 | $107,281 | $27,650 | $79,631 |
| 2020 | $2,277 | $101,324 | $25,550 | $75,774 |
| 2019 | $2,041 | $96,764 | $23,100 | $73,664 |
| 2018 | $1,947 | $82,131 | $18,550 | $63,581 |
| 2017 | $2,579 | $76,896 | $16,800 | $60,096 |
| 2016 | $1,823 | $67,385 | $13,650 | $53,735 |
| 2015 | $1,819 | $60,929 | $9,800 | $51,129 |
| 2014 | $1,766 | $52,669 | $9,800 | $42,869 |
Source: Public Records
Map
Nearby Homes
- 5528 Oatfield St
- 1602 Morning Bell Ave
- 1004 Windy Ferrell Ave
- 1113 E Hammer Ln
- 5605 Midnight Breeze St
- 5614 Midnight Breeze St
- 1114 Crystal Grotto Ave
- 1110 Crystal Grotto Ave
- 1817 Cosmo Star Ave
- 5630 Midnight Breeze St
- 1808 Luxor Lights Ave
- 5733 Tall Redstone St
- 5440 Aladdin Dream St
- 5436 Aladdin Dream St
- 5627 Mesa Sedona St
- 5713 Lawrence St
- 5639 Mesa Sedona St
- 2117 Leatherbridge Ct
- 1109 Jewel Springs Ln
- 5685 Colbert St
- 1204 Windy Ferrell Ave
- 5513 Oatfield St
- 1120 Windy Ferrell Ave
- 1125 Plumb Ridge Ave
- 5492 Oatfield St
- 5492 Oatfield St
- 5492 Oatfield St Unit na
- 5504 Oatfield St
- 5509 Oatfield St
- 5488 Oatfield St
- 1209 Windy Ferrell Ave
- 1116 Windy Ferrell Ave
- 1205 Windy Ferrell Ave
- 1121 Plumb Ridge Ave
- 5508 Oatfield St
- 5508 Oatfield St Unit None
- 1121 Windy Ferrell Ave
- 5512 Oatfield St
- 1117 Plumb Ridge Ave
- 1112 Windy Ferrell Ave