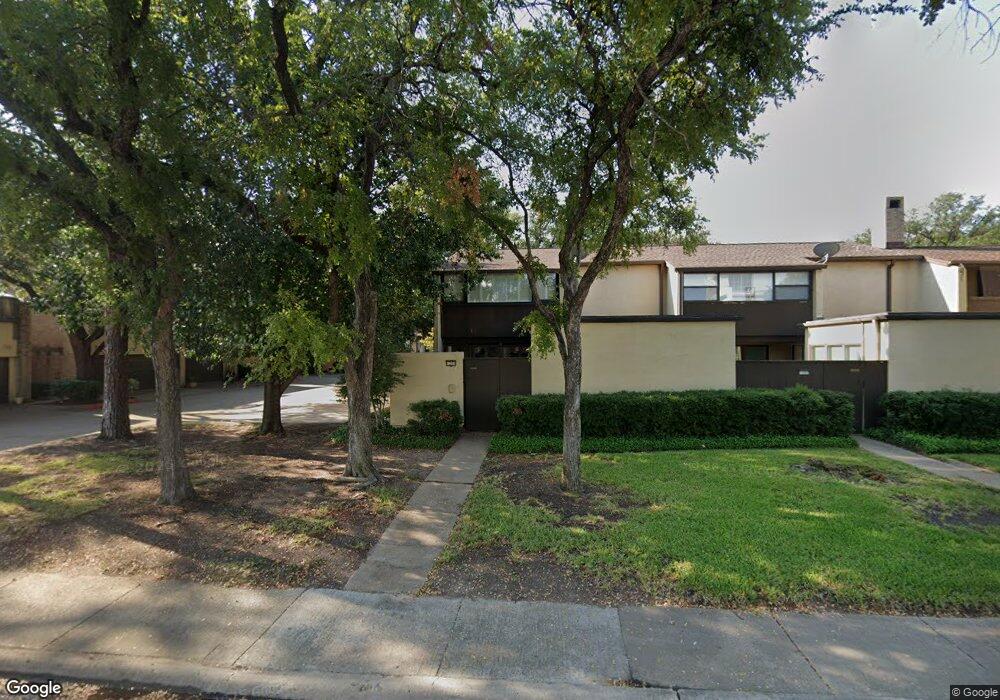
1208I Lane St Unit 1208 Irving, TX 75061
Hospital District NeighborhoodEstimated Value: $225,708 - $250,000
3
Beds
3
Baths
1,600
Sq Ft
$149/Sq Ft
Est. Value
About This Home
This home is located at 1208I Lane St Unit 1208, Irving, TX 75061 and is currently estimated at $237,927, approximately $148 per square foot. 1208I Lane St Unit 1208 is a home located in Dallas County with nearby schools including Lively Elementary School, Lorenzo De Zavala Middle, and Irving High School.
Ownership History
Date
Name
Owned For
Owner Type
Purchase Details
Closed on
Oct 3, 2018
Sold by
Brand Patrick Richard and Brand Kathleen K
Bought by
Joy Mark
Current Estimated Value
Home Financials for this Owner
Home Financials are based on the most recent Mortgage that was taken out on this home.
Original Mortgage
$114,000
Outstanding Balance
$99,415
Interest Rate
4.5%
Mortgage Type
New Conventional
Estimated Equity
$138,512
Purchase Details
Closed on
Aug 31, 2017
Sold by
Brand Patrick R and Brand Katheleen K
Bought by
Brand Patrick Richard and Brand Kathleen K
Purchase Details
Closed on
Aug 10, 2016
Sold by
Mayne Charles Deryk
Bought by
Brand Kathleen K
Purchase Details
Closed on
Nov 20, 2012
Sold by
Estate Of Mary F Wilkerson
Bought by
Mayne Charles Deryk
Home Financials for this Owner
Home Financials are based on the most recent Mortgage that was taken out on this home.
Original Mortgage
$91,935
Interest Rate
3.4%
Mortgage Type
VA
Create a Home Valuation Report for This Property
The Home Valuation Report is an in-depth analysis detailing your home's value as well as a comparison with similar homes in the area
Home Values in the Area
Average Home Value in this Area
Purchase History
| Date | Buyer | Sale Price | Title Company |
|---|---|---|---|
| Joy Mark | -- | Texas Premier Title | |
| Brand Patrick Richard | -- | None Available | |
| Brand Kathleen K | -- | Attorney | |
| Mayne Charles Deryk | -- | None Available |
Source: Public Records
Mortgage History
| Date | Status | Borrower | Loan Amount |
|---|---|---|---|
| Open | Joy Mark | $114,000 | |
| Previous Owner | Mayne Charles Deryk | $91,935 |
Source: Public Records
Tax History Compared to Growth
Tax History
| Year | Tax Paid | Tax Assessment Tax Assessment Total Assessment is a certain percentage of the fair market value that is determined by local assessors to be the total taxable value of land and additions on the property. | Land | Improvement |
|---|---|---|---|---|
| 2025 | $3,263 | $237,330 | $52,520 | $184,810 |
| 2024 | $3,263 | $234,200 | $52,520 | $181,680 |
| 2023 | $3,263 | $232,000 | $31,510 | $200,490 |
| 2022 | $5,350 | $232,000 | $31,510 | $200,490 |
| 2021 | $4,063 | $168,000 | $31,510 | $136,490 |
| 2020 | $4,215 | $168,000 | $31,510 | $136,490 |
| 2019 | $4,455 | $168,000 | $31,510 | $136,490 |
| 2018 | $3,862 | $144,000 | $31,510 | $112,490 |
| 2017 | $3,272 | $121,450 | $31,510 | $89,940 |
| 2016 | $2,586 | $96,000 | $31,510 | $64,490 |
| 2015 | $2,370 | $88,000 | $31,510 | $56,490 |
| 2014 | $2,370 | $88,000 | $31,510 | $56,490 |
Source: Public Records
Map
Nearby Homes
- 1809 N Macarthur Blvd
- 1710 Timbers Dr
- 1701 Timbers Dr
- 816 Glenview Dr
- 1519 Sunnybrook Dr
- 1620 Oak Meadow Dr
- 909 W Grauwyler Rd
- 1604 Oak Meadow Dr
- 1513 Canyon Oaks Dr
- 1509 Glenbrook Dr
- 1401 N Rogers Rd
- 2405 Summit Dr
- 1317 Broadmoor Ln
- 1627 Priscilla Ln
- 1719 Belmead Ln
- 1401 Limetree Ln
- 1513 Arcady Ln
- 2101 Oakhurst Dr Unit A-D
- 1313 Limetree Ln
- 1914 W Grauwyler Rd
- 1200I Lane St Unit 1200
- 1204I Lane St Unit 1204
- 1206I Lane St Unit 1206
- 1202I Lane St Unit 1202
- 1202 Lane St
- 1204 Lane St
- 1816 Mojave Place
- 1814G Mojave Place Unit 1816
- 1814 Mojave Place
- 1816G Mojave Place Unit 1816
- 1810G Mojave Place Unit 1810
- 1808G Mojave Place Unit 1808
- 1812G Mojave Place Unit 1812
- 1208 Lane St Unit 1208
- 1208 Lane St
- 1810 Mojave Place
- 1810 Mojave Place Unit 1810
- 1808 Mojave Place
- 1806 Navajo Place Unit 1806
- 1804 Navajo Place Unit 1804