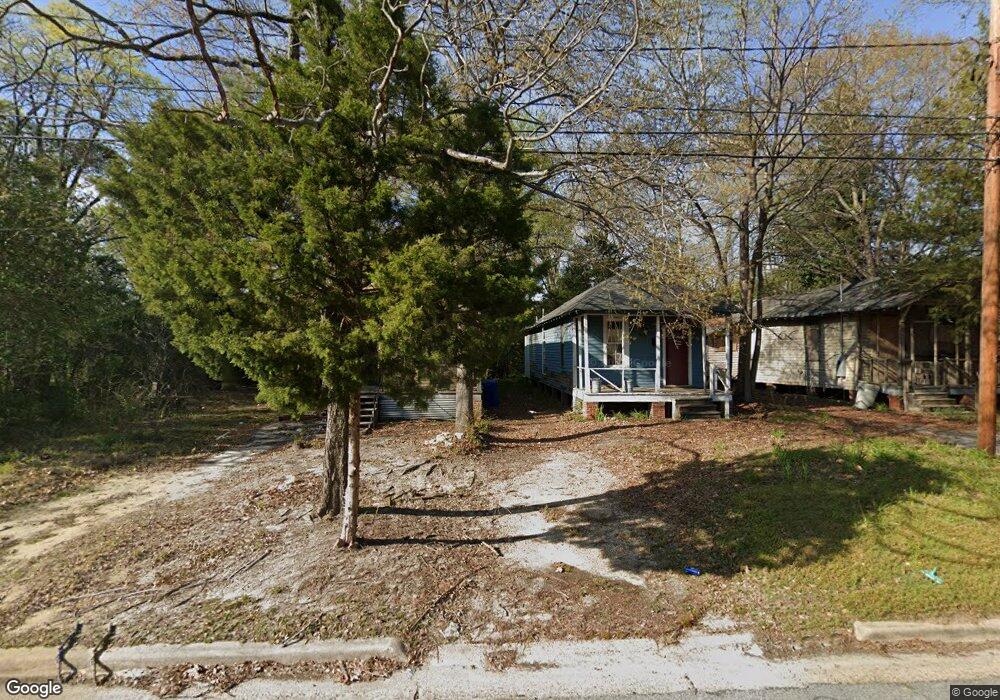
1209 22nd St Columbus, GA 31901
East Highlands NeighborhoodEstimated Value: $114,964 - $194,000
2
Beds
2
Baths
896
Sq Ft
$167/Sq Ft
Est. Value
About This Home
This home is located at 1209 22nd St, Columbus, GA 31901 and is currently estimated at $149,741, approximately $167 per square foot. 1209 22nd St is a home located in Muscogee County with nearby schools including Arnold Middle School, Jordan Vocational High School, and Wynnton Elementary School.
Ownership History
Date
Name
Owned For
Owner Type
Purchase Details
Closed on
Jul 29, 2022
Sold by
Big Mamas Stuff Llc
Bought by
Flournoy John Steven
Current Estimated Value
Home Financials for this Owner
Home Financials are based on the most recent Mortgage that was taken out on this home.
Original Mortgage
$56,823
Outstanding Balance
$42,604
Interest Rate
5.7%
Mortgage Type
New Conventional
Estimated Equity
$107,137
Purchase Details
Closed on
Jan 13, 2012
Sold by
Greater Columbus Propertie
Bought by
Big Mamas Stuff Llc
Purchase Details
Closed on
Dec 15, 2011
Sold by
Community Bank & Trust Wes
Bought by
Greater Columbus Properties Ll
Purchase Details
Closed on
Dec 7, 2010
Sold by
Cherokee Developers Inc
Bought by
Community Bank & Trust West Georgia
Create a Home Valuation Report for This Property
The Home Valuation Report is an in-depth analysis detailing your home's value as well as a comparison with similar homes in the area
Home Values in the Area
Average Home Value in this Area
Purchase History
| Date | Buyer | Sale Price | Title Company |
|---|---|---|---|
| Flournoy John Steven | -- | None Listed On Document | |
| Big Mamas Stuff Llc | -- | -- | |
| Greater Columbus Properties Ll | $8,000 | -- | |
| Community Bank & Trust West Georgia | $12,500 | None Available |
Source: Public Records
Mortgage History
| Date | Status | Borrower | Loan Amount |
|---|---|---|---|
| Open | Flournoy John Steven | $56,823 |
Source: Public Records
Tax History
| Year | Tax Paid | Tax Assessment Tax Assessment Total Assessment is a certain percentage of the fair market value that is determined by local assessors to be the total taxable value of land and additions on the property. | Land | Improvement |
|---|---|---|---|---|
| 2025 | $3,856 | $44,412 | $9,396 | $35,016 |
| 2024 | $1,739 | $44,412 | $9,396 | $35,016 |
| 2023 | $457 | $11,600 | $4,080 | $7,520 |
| 2022 | $327 | $12,256 | $9,396 | $2,860 |
| 2021 | $327 | $8,000 | $1,644 | $6,356 |
| 2020 | $327 | $8,000 | $1,644 | $6,356 |
| 2019 | $439 | $12,600 | $3,780 | $8,820 |
| 2018 | $516 | $12,600 | $3,780 | $8,820 |
| 2017 | $518 | $12,600 | $3,780 | $8,820 |
| 2016 | $512 | $12,400 | $4,368 | $8,032 |
| 2015 | $205 | $12,400 | $4,368 | $8,032 |
| 2014 | $306 | $18,483 | $4,368 | $14,115 |
| 2013 | -- | $18,483 | $4,368 | $14,115 |
Source: Public Records
Map
Nearby Homes
Your Personal Tour Guide
Ask me questions while you tour the home.