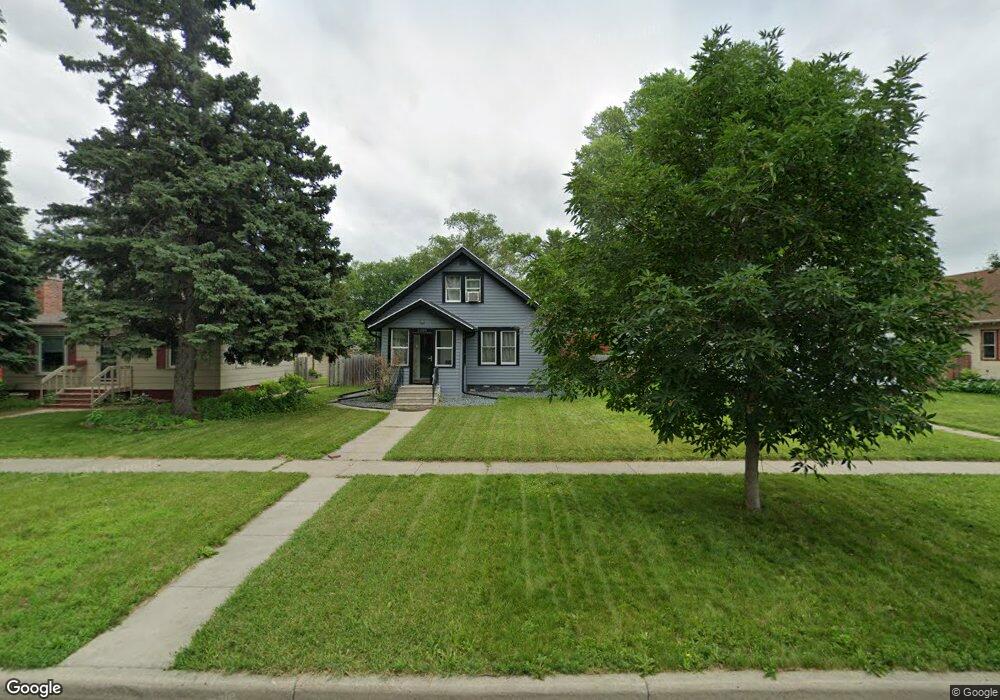
1209 2nd St N Fargo, ND 58102
Horace Mann NeighborhoodEstimated Value: $257,000 - $277,000
3
Beds
2
Baths
2,448
Sq Ft
$108/Sq Ft
Est. Value
About This Home
This home is located at 1209 2nd St N, Fargo, ND 58102 and is currently estimated at $264,924, approximately $108 per square foot. 1209 2nd St N is a home located in Cass County with nearby schools including Horace Mann Roosevelt Elementary School, Ben Franklin Middle School, and North High School.
Ownership History
Date
Name
Owned For
Owner Type
Purchase Details
Closed on
Aug 29, 2019
Sold by
Jma Llc
Bought by
Stuck Elliot L
Current Estimated Value
Home Financials for this Owner
Home Financials are based on the most recent Mortgage that was taken out on this home.
Original Mortgage
$169,750
Outstanding Balance
$148,992
Interest Rate
3.7%
Mortgage Type
New Conventional
Estimated Equity
$115,932
Purchase Details
Closed on
Dec 22, 2016
Sold by
Anderson John M and Tami Rae Wiese Trust
Bought by
Jma Llc
Purchase Details
Closed on
Apr 12, 2016
Sold by
Riggs Todd and Riggs Tami R
Bought by
Anderson John M and Tami Rae Wiese Trust
Purchase Details
Closed on
Mar 21, 2006
Sold by
Wiese Jeffery Brian
Bought by
Wiese Tami Rae
Create a Home Valuation Report for This Property
The Home Valuation Report is an in-depth analysis detailing your home's value as well as a comparison with similar homes in the area
Home Values in the Area
Average Home Value in this Area
Purchase History
| Date | Buyer | Sale Price | Title Company |
|---|---|---|---|
| Stuck Elliot L | $175,000 | None Available | |
| Jma Llc | -- | North Dakota Guaranty & Titl | |
| Anderson John M | $115,000 | Fargo Title Inc | |
| Wiese Tami Rae | -- | -- |
Source: Public Records
Mortgage History
| Date | Status | Borrower | Loan Amount |
|---|---|---|---|
| Open | Stuck Elliot L | $169,750 |
Source: Public Records
Tax History
| Year | Tax Paid | Tax Assessment Tax Assessment Total Assessment is a certain percentage of the fair market value that is determined by local assessors to be the total taxable value of land and additions on the property. | Land | Improvement |
|---|---|---|---|---|
| 2024 | $3,633 | $111,400 | $22,400 | $89,000 |
| 2023 | $3,530 | $108,150 | $22,400 | $85,750 |
| 2022 | $3,521 | $106,050 | $22,400 | $83,650 |
| 2021 | $3,280 | $99,100 | $22,400 | $76,700 |
| 2020 | $3,122 | $94,400 | $22,400 | $72,000 |
| 2019 | $3,124 | $94,400 | $12,450 | $81,950 |
| 2018 | $2,781 | $82,200 | $12,450 | $69,750 |
| 2017 | $2,658 | $78,300 | $12,450 | $65,850 |
| 2016 | $2,293 | $69,900 | $12,450 | $57,450 |
| 2015 | $2,403 | $69,900 | $9,350 | $60,550 |
| 2014 | $2,143 | $70,550 | $9,350 | $61,200 |
| 2013 | $2,145 | $70,550 | $9,350 | $61,200 |
Source: Public Records
Map
Nearby Homes
- 1245 1st St N
- 1261 4th St N
- 1125 5th St N
- 1345 4th St N
- 1119 Broadway N
- 901 3rd St N
- 1120 Broadway N
- 1002 5th St N
- 1111 7th St N
- 915 Broadway N
- 804 3rd St N
- 624 10th Ave N
- 611 9th Ave N
- 1437 Broadway N Unit 101
- 730 Elm St N Unit B1
- 1316 8th St N
- 714 Oak St N
- 1119 9th St N
- 702 Oak St N Unit A
- 609 3rd St N
Your Personal Tour Guide
Ask me questions while you tour the home.