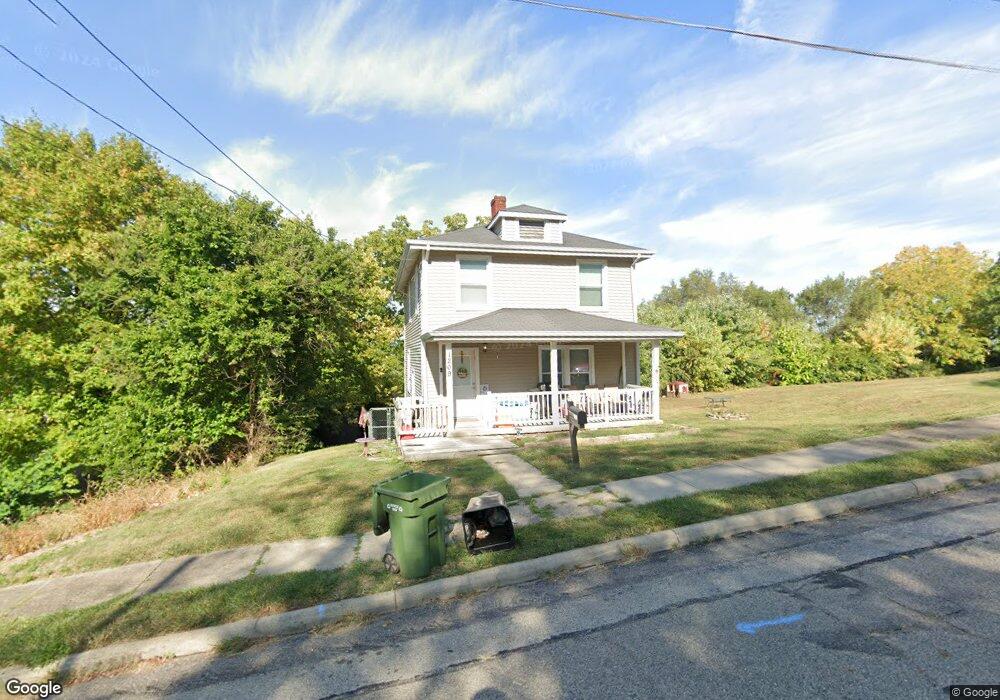
1209 4th St Cincinnati, OH 45215
Estimated Value: $141,765 - $238,000
2
Beds
1
Bath
1,370
Sq Ft
$134/Sq Ft
Est. Value
About This Home
This home is located at 1209 4th St, Cincinnati, OH 45215 and is currently estimated at $182,941, approximately $133 per square foot. 1209 4th St is a home located in Hamilton County with nearby schools including Reading Community High School, Saints Peter and Paul Academy, and Mount Notre Dame High School.
Ownership History
Date
Name
Owned For
Owner Type
Purchase Details
Closed on
Dec 2, 2024
Sold by
Worley Rita M
Bought by
Worley Rita M and Conner Donald R
Current Estimated Value
Purchase Details
Closed on
Oct 28, 2013
Sold by
Conner Don and Conner Margie
Bought by
Worley Rita M
Home Financials for this Owner
Home Financials are based on the most recent Mortgage that was taken out on this home.
Original Mortgage
$55,600
Interest Rate
4.33%
Mortgage Type
Unknown
Purchase Details
Closed on
Jul 13, 2011
Sold by
Kamme Gindele Karen
Bought by
Conner Don
Create a Home Valuation Report for This Property
The Home Valuation Report is an in-depth analysis detailing your home's value as well as a comparison with similar homes in the area
Home Values in the Area
Average Home Value in this Area
Purchase History
| Date | Buyer | Sale Price | Title Company |
|---|---|---|---|
| Worley Rita M | -- | None Listed On Document | |
| Worley Rita M | -- | None Listed On Document | |
| Worley Rita M | $69,500 | Attorney | |
| Conner Don | $2,000 | Platinum Title Services |
Source: Public Records
Mortgage History
| Date | Status | Borrower | Loan Amount |
|---|---|---|---|
| Previous Owner | Worley Rita M | $55,600 |
Source: Public Records
Tax History
| Year | Tax Paid | Tax Assessment Tax Assessment Total Assessment is a certain percentage of the fair market value that is determined by local assessors to be the total taxable value of land and additions on the property. | Land | Improvement |
|---|---|---|---|---|
| 2025 | $1,774 | $33,453 | $8,736 | $24,717 |
| 2024 | $1,732 | $33,453 | $8,736 | $24,717 |
| 2023 | $1,758 | $33,453 | $8,736 | $24,717 |
| 2022 | $1,771 | $26,125 | $7,025 | $19,100 |
| 2021 | $1,478 | $26,125 | $7,025 | $19,100 |
| 2020 | $1,494 | $26,125 | $7,025 | $19,100 |
| 2019 | $1,448 | $23,118 | $6,216 | $16,902 |
| 2018 | $1,450 | $23,118 | $6,216 | $16,902 |
| 2017 | $1,366 | $23,118 | $6,216 | $16,902 |
| 2016 | $1,433 | $24,326 | $515 | $23,811 |
| 2015 | $1,446 | $24,326 | $515 | $23,811 |
| 2014 | $1,265 | $24,326 | $515 | $23,811 |
| 2013 | $39 | $700 | $525 | $175 |
Source: Public Records
Map
Nearby Homes
Your Personal Tour Guide
Ask me questions while you tour the home.