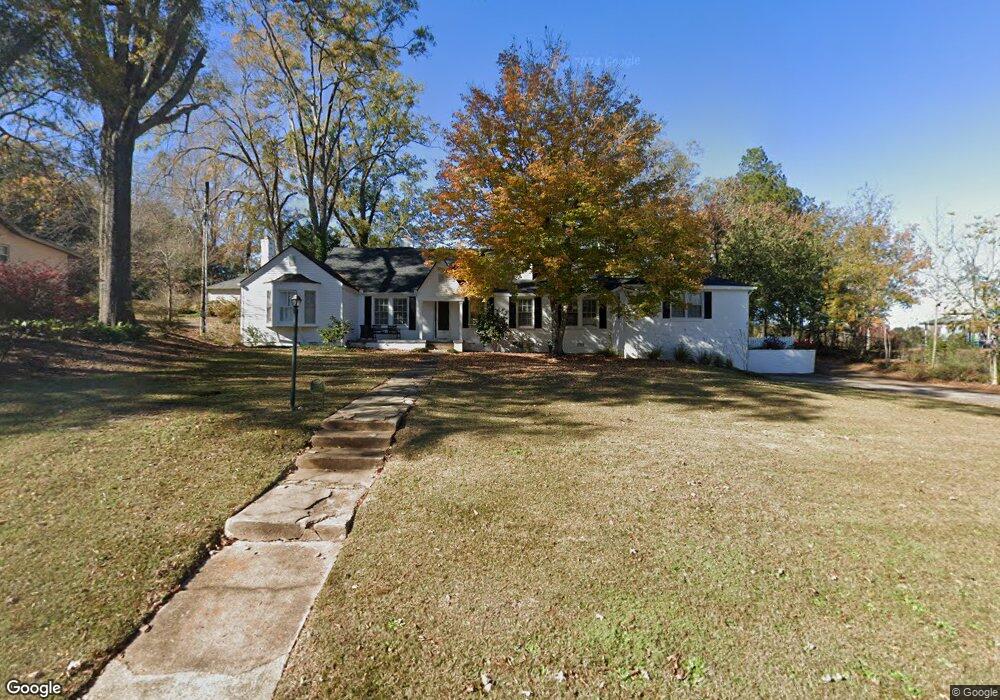
1209 6th Ave West Point, GA 31833
Estimated Value: $123,000 - $167,000
4
Beds
2
Baths
2,364
Sq Ft
$60/Sq Ft
Est. Value
About This Home
This home is located at 1209 6th Ave, West Point, GA 31833 and is currently estimated at $142,355, approximately $60 per square foot. 1209 6th Ave is a home located in Troup County with nearby schools including West Point Elementary School, Long Cane Elementary School, and Whitesville Road Elementary School.
Ownership History
Date
Name
Owned For
Owner Type
Purchase Details
Closed on
Jun 22, 2009
Sold by
Hsbc Bank Usa Na
Bought by
Smith Mark
Current Estimated Value
Purchase Details
Closed on
Apr 2, 1998
Sold by
Kay Simms
Bought by
Friedman Marita S
Purchase Details
Closed on
Apr 1, 1998
Sold by
Christy Hill
Bought by
Kay Simms
Purchase Details
Closed on
Feb 10, 1998
Sold by
Kathryn L Soenksen
Bought by
Christy Hill
Purchase Details
Closed on
Jan 27, 1997
Sold by
Leroy C Soenksen By Ex
Bought by
Kathryn L Soenksen
Purchase Details
Closed on
Jan 1, 1967
Bought by
Leroy C Soenksen By Ex
Create a Home Valuation Report for This Property
The Home Valuation Report is an in-depth analysis detailing your home's value as well as a comparison with similar homes in the area
Home Values in the Area
Average Home Value in this Area
Purchase History
| Date | Buyer | Sale Price | Title Company |
|---|---|---|---|
| Smith Mark | $46,000 | -- | |
| Smith Mark | $46,000 | -- | |
| Friedman Marita S | -- | -- | |
| Kay Simms | -- | -- | |
| Christy Hill | -- | -- | |
| Kathryn L Soenksen | -- | -- | |
| Leroy C Soenksen By Ex | -- | -- |
Source: Public Records
Tax History Compared to Growth
Tax History
| Year | Tax Paid | Tax Assessment Tax Assessment Total Assessment is a certain percentage of the fair market value that is determined by local assessors to be the total taxable value of land and additions on the property. | Land | Improvement |
|---|---|---|---|---|
| 2024 | $1,856 | $52,476 | $2,480 | $49,996 |
| 2023 | $1,879 | $52,756 | $2,480 | $50,276 |
| 2022 | $1,165 | $41,756 | $2,480 | $39,276 |
| 2021 | $886 | $29,364 | $2,480 | $26,884 |
| 2020 | $886 | $29,364 | $2,480 | $26,884 |
| 2019 | $871 | $28,872 | $2,432 | $26,440 |
| 2018 | $833 | $27,628 | $2,432 | $25,196 |
| 2017 | $833 | $27,628 | $2,432 | $25,196 |
| 2016 | $824 | $27,334 | $2,432 | $24,902 |
| 2015 | $826 | $27,334 | $2,432 | $24,902 |
| 2014 | $787 | $26,023 | $2,432 | $23,591 |
| 2013 | -- | $28,082 | $2,432 | $25,650 |
Source: Public Records
Map
Nearby Homes
- 1314 4th Ave
- 1410 Roper Ave
- 1007 4th Ave
- 1508 N 4th Ave
- 712 4th Ave
- 909 N 13th St
- 1114 N 18th St
- 1505 Wisteria Dr
- 304 N 11th Ave Unit N 11th Ave
- 811 Cherry Dr
- 813 Cherry Dr
- 514 N 8th Ave
- 302 N 6th Ave
- 311 E 4th St
- 806 N 5th St
- 713 Avenue H
- 1008 E 12th St
- 804 E 6th St
- 1903 Ridgewood Dr
- 0 Arrowhead Dr Unit 10451860