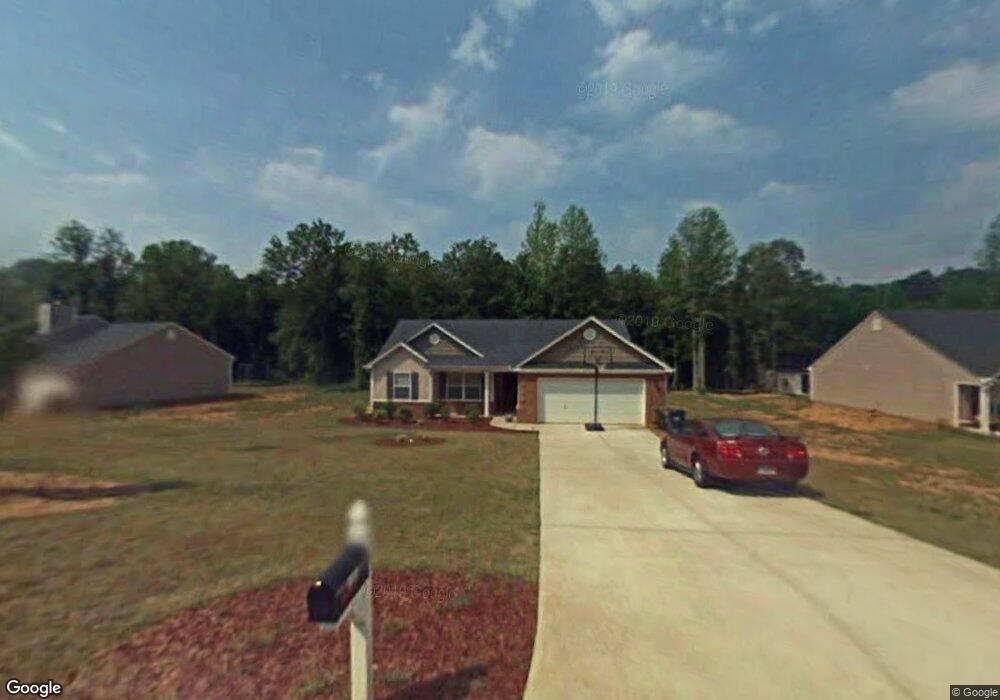
1209 Casper Ln Winder, GA 30680
Estimated Value: $266,000 - $331,000
3
Beds
2
Baths
1,297
Sq Ft
$229/Sq Ft
Est. Value
About This Home
This home is located at 1209 Casper Ln, Winder, GA 30680 and is currently estimated at $297,559, approximately $229 per square foot. 1209 Casper Ln is a home located in Barrow County with nearby schools including Bethlehem Elementary School, Haymon-Morris Middle School, and Apalachee High School.
Ownership History
Date
Name
Owned For
Owner Type
Purchase Details
Closed on
Dec 10, 2010
Sold by
Federal Home Loan Mortgage Corporation
Bought by
Harrell Justin D
Current Estimated Value
Home Financials for this Owner
Home Financials are based on the most recent Mortgage that was taken out on this home.
Original Mortgage
$79,792
Outstanding Balance
$52,985
Interest Rate
4.32%
Mortgage Type
New Conventional
Estimated Equity
$244,574
Purchase Details
Closed on
Jul 6, 2010
Sold by
Ocwen Ln Servicing Llc
Bought by
Federal Home Loan Mortgage Corporation
Purchase Details
Closed on
Apr 13, 2006
Sold by
Star Hm Builders Inc
Bought by
Cross M Joy
Home Financials for this Owner
Home Financials are based on the most recent Mortgage that was taken out on this home.
Original Mortgage
$132,900
Interest Rate
6.2%
Mortgage Type
New Conventional
Purchase Details
Closed on
Nov 12, 2004
Sold by
Montana Development Inc
Bought by
Star Home Builders Inc
Purchase Details
Closed on
Apr 14, 2004
Bought by
Montana Development Inc
Create a Home Valuation Report for This Property
The Home Valuation Report is an in-depth analysis detailing your home's value as well as a comparison with similar homes in the area
Home Values in the Area
Average Home Value in this Area
Purchase History
| Date | Buyer | Sale Price | Title Company |
|---|---|---|---|
| Harrell Justin D | -- | -- | |
| Federal Home Loan Mortgage Corporation | -- | -- | |
| Ocwen Ln Servicing Llc | $100,000 | -- | |
| Cross M Joy | $132,900 | -- | |
| Star Home Builders Inc | $546,000 | -- | |
| Montana Development Inc | -- | -- |
Source: Public Records
Mortgage History
| Date | Status | Borrower | Loan Amount |
|---|---|---|---|
| Open | Harrell Justin D | $79,792 | |
| Previous Owner | Cross M Joy | $132,900 | |
| Closed | Star Home Builders Inc | $0 |
Source: Public Records
Tax History Compared to Growth
Tax History
| Year | Tax Paid | Tax Assessment Tax Assessment Total Assessment is a certain percentage of the fair market value that is determined by local assessors to be the total taxable value of land and additions on the property. | Land | Improvement |
|---|---|---|---|---|
| 2024 | $1,943 | $78,084 | $16,000 | $62,084 |
| 2023 | $2,222 | $78,484 | $16,000 | $62,484 |
| 2022 | $1,502 | $52,328 | $16,000 | $36,328 |
| 2021 | $1,573 | $52,328 | $16,000 | $36,328 |
| 2020 | $1,574 | $52,328 | $16,000 | $36,328 |
| 2019 | $1,600 | $52,328 | $16,000 | $36,328 |
| 2018 | $1,443 | $48,328 | $12,000 | $36,328 |
| 2017 | $1,168 | $40,120 | $12,000 | $28,120 |
| 2016 | $1,173 | $40,428 | $12,000 | $28,428 |
| 2015 | $1,188 | $40,736 | $12,000 | $28,736 |
| 2014 | $1,071 | $36,688 | $7,644 | $29,044 |
| 2013 | -- | $35,256 | $7,644 | $27,612 |
Source: Public Records
Map
Nearby Homes