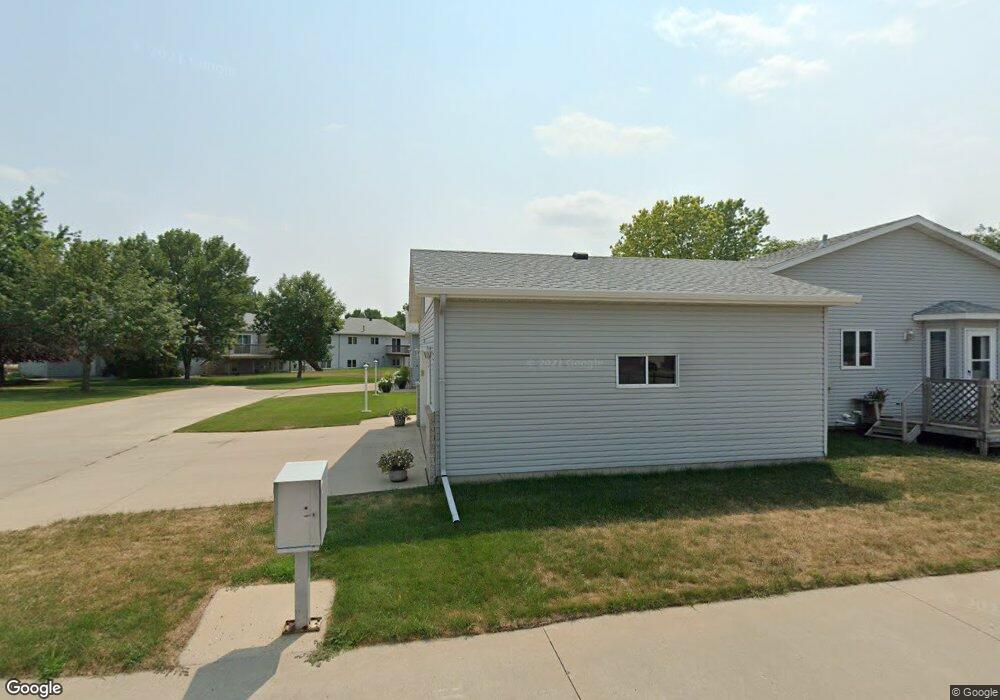
1209 Cedar Way West Fargo, ND 58078
Tintes NeighborhoodEstimated Value: $229,000 - $292,000
2
Beds
2
Baths
1,221
Sq Ft
$217/Sq Ft
Est. Value
About This Home
This home is located at 1209 Cedar Way, West Fargo, ND 58078 and is currently estimated at $265,351, approximately $217 per square foot. 1209 Cedar Way is a home located in Cass County with nearby schools including Willow Park Elementary School, Cheney Middle School, and West Fargo High School.
Ownership History
Date
Name
Owned For
Owner Type
Purchase Details
Closed on
Oct 14, 2015
Sold by
Schaefer Timothy C and Schaefer Elaine M
Bought by
Engelhard Kimberly K
Current Estimated Value
Home Financials for this Owner
Home Financials are based on the most recent Mortgage that was taken out on this home.
Original Mortgage
$61,000
Outstanding Balance
$47,994
Interest Rate
3.88%
Mortgage Type
New Conventional
Estimated Equity
$217,357
Purchase Details
Closed on
Jun 8, 2007
Sold by
Warner Jay and Estate Of Belvedere A Warner
Bought by
Schaefer Timothy C and Schaefer Elaine M
Home Financials for this Owner
Home Financials are based on the most recent Mortgage that was taken out on this home.
Original Mortgage
$22,500
Interest Rate
6.21%
Mortgage Type
Purchase Money Mortgage
Create a Home Valuation Report for This Property
The Home Valuation Report is an in-depth analysis detailing your home's value as well as a comparison with similar homes in the area
Home Values in the Area
Average Home Value in this Area
Purchase History
| Date | Buyer | Sale Price | Title Company |
|---|---|---|---|
| Engelhard Kimberly K | $188,000 | Title Co | |
| Schaefer Timothy C | -- | -- |
Source: Public Records
Mortgage History
| Date | Status | Borrower | Loan Amount |
|---|---|---|---|
| Open | Engelhard Kimberly K | $61,000 | |
| Previous Owner | Schaefer Timothy C | $22,500 |
Source: Public Records
Tax History Compared to Growth
Tax History
| Year | Tax Paid | Tax Assessment Tax Assessment Total Assessment is a certain percentage of the fair market value that is determined by local assessors to be the total taxable value of land and additions on the property. | Land | Improvement |
|---|---|---|---|---|
| 2024 | $3,034 | $122,350 | $20,000 | $102,350 |
| 2023 | $3,486 | $120,100 | $20,000 | $100,100 |
| 2022 | $3,350 | $110,850 | $20,000 | $90,850 |
| 2021 | $3,132 | $99,650 | $15,500 | $84,150 |
| 2020 | $3,082 | $101,300 | $15,500 | $85,800 |
| 2019 | $2,818 | $98,100 | $15,500 | $82,600 |
| 2018 | $2,647 | $94,950 | $15,500 | $79,450 |
| 2017 | $2,468 | $90,000 | $15,500 | $74,500 |
| 2016 | $2,185 | $86,950 | $15,500 | $71,450 |
| 2015 | $2,221 | $81,350 | $10,950 | $70,400 |
| 2014 | $2,180 | $76,050 | $10,950 | $65,100 |
| 2013 | $2,216 | $76,050 | $10,950 | $65,100 |
Source: Public Records
Map
Nearby Homes
- 1221 Cedar Way
- 987 14th Ave E
- 1522 Baywood Dr
- 1534 Baywood Dr
- 1511 11th Ave E
- 851 12th Ave E
- 670 13th Ave E
- 1829 13th St E
- 1845 Huntington Ct
- 1836 12th St E
- 631 15th Ave E
- 1859 13th St E
- 724 Northridge Way
- 921 Homestead Ct
- 716 Northridge Way
- 1842 52nd St S
- 1059 Sommerset Place
- 1811 7th St E
- 437 10th Ave E
- 336 13th Ave E
- 1205 Cedar Way
- 1415 12th Street Ct
- 1502 14th St E
- 1500 14th St E
- 1504 14th St E
- 1417 12th Street Ct
- 1208 Cedar Way
- 1212 Cedar Way
- 1467 12th Street Ct
- 1469 12 St Ct St E
- 1220 Cedar Way
- 1460 14th St E
- 1463 12th Street Ct
- 1469 12th Street Ct
- 1419 12th Street Ct
- 1410 12th Street Ct
- 1458 14th St E
- 1224 Cedar Way
- 1461 12th Street Ct
- 1423 12th Street Ct