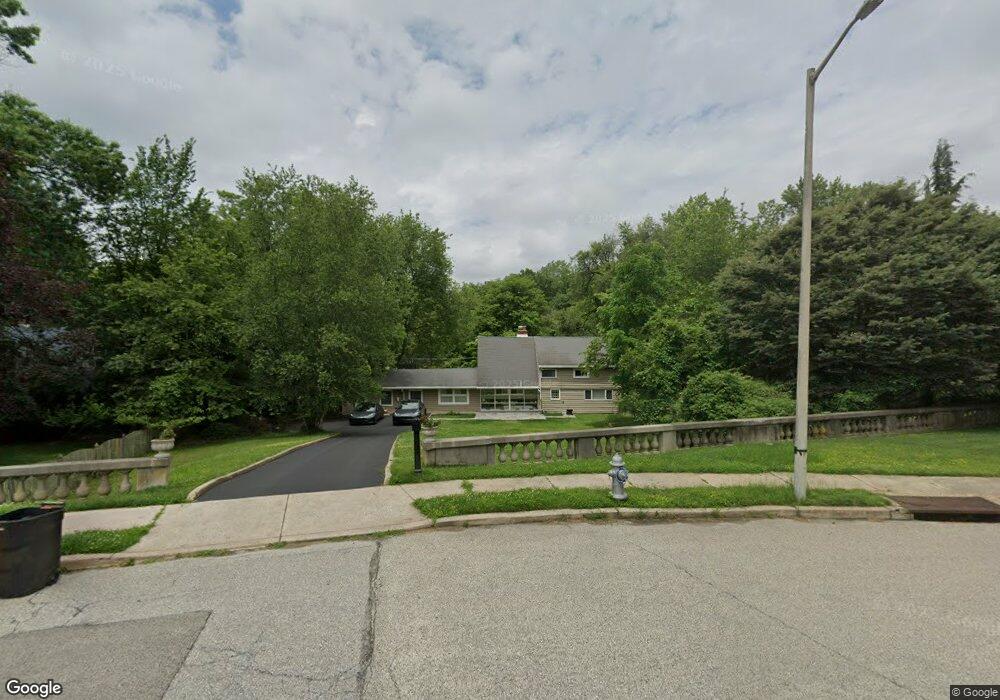
1209 Claridge Rd Glenside, PA 19038
Estimated Value: $530,000 - $554,655
4
Beds
3
Baths
2,283
Sq Ft
$237/Sq Ft
Est. Value
About This Home
This home is located at 1209 Claridge Rd, Glenside, PA 19038 and is currently estimated at $541,664, approximately $237 per square foot. 1209 Claridge Rd is a home located in Montgomery County with nearby schools including Enfield Elementary School, Erdenheim Elementary School, and Springfield Township Middle School.
Ownership History
Date
Name
Owned For
Owner Type
Purchase Details
Closed on
Sep 28, 2011
Sold by
Noble Real Estate Llc
Bought by
Sey George W
Current Estimated Value
Home Financials for this Owner
Home Financials are based on the most recent Mortgage that was taken out on this home.
Original Mortgage
$247,855
Outstanding Balance
$168,884
Interest Rate
4.08%
Estimated Equity
$372,780
Purchase Details
Closed on
Sep 1, 2011
Sold by
Lewis Joslyn
Bought by
Chesapeake Loan Servicing Llc
Home Financials for this Owner
Home Financials are based on the most recent Mortgage that was taken out on this home.
Original Mortgage
$247,855
Outstanding Balance
$168,884
Interest Rate
4.08%
Estimated Equity
$372,780
Purchase Details
Closed on
Apr 15, 2001
Sold by
Goodrich Fay K and Porter Bunny
Bought by
Lewis Joslyn
Create a Home Valuation Report for This Property
The Home Valuation Report is an in-depth analysis detailing your home's value as well as a comparison with similar homes in the area
Home Values in the Area
Average Home Value in this Area
Purchase History
| Date | Buyer | Sale Price | Title Company |
|---|---|---|---|
| Sey George W | $260,900 | None Available | |
| Chesapeake Loan Servicing Llc | $177,600 | None Available | |
| Lewis Joslyn | $177,900 | -- |
Source: Public Records
Mortgage History
| Date | Status | Borrower | Loan Amount |
|---|---|---|---|
| Open | Sey George W | $247,855 |
Source: Public Records
Tax History Compared to Growth
Tax History
| Year | Tax Paid | Tax Assessment Tax Assessment Total Assessment is a certain percentage of the fair market value that is determined by local assessors to be the total taxable value of land and additions on the property. | Land | Improvement |
|---|---|---|---|---|
| 2025 | $6,686 | $141,950 | $60,030 | $81,920 |
| 2024 | $6,686 | $141,950 | $60,030 | $81,920 |
| 2023 | $6,453 | $141,950 | $60,030 | $81,920 |
| 2022 | $6,268 | $141,950 | $60,030 | $81,920 |
| 2021 | $6,105 | $141,950 | $60,030 | $81,920 |
| 2020 | $5,962 | $141,950 | $60,030 | $81,920 |
| 2019 | $5,870 | $141,950 | $60,030 | $81,920 |
| 2018 | $5,870 | $141,950 | $60,030 | $81,920 |
| 2017 | $5,604 | $141,950 | $60,030 | $81,920 |
| 2016 | $5,549 | $141,950 | $60,030 | $81,920 |
| 2015 | $5,274 | $141,950 | $60,030 | $81,920 |
| 2014 | $5,274 | $141,950 | $60,030 | $81,920 |
Source: Public Records
Map
Nearby Homes
- 8550 Trumbauer Dr Unit L35
- 8407 Hull Dr
- 8705 Patton Rd
- 8612 Trumbauer Dr
- 8304 Cheltenham Ave
- 8778 Duveen Dr
- 1641 Chattin Rd
- 1104 Cromwell Rd
- 1612 E Willow Grove Ave
- 1118 E Willow Grove Ave
- 1001 E Willow Grove Ave
- 418 Glenway Rd
- 7906 Chandler Rd
- 303 Glenway Rd
- 1106 E Pleasant Ave
- 402 Longfield Rd
- 822 E Pleasant St
- 1603 Hillcrest Rd
- 223 Larrimore Ln
- 7710 Queen St
- 1207 Claridge Rd
- 1211 Claridge Rd
- 1205 Claridge Rd
- 8608 Patton Rd
- 8610 Patton Rd
- 8517 Widener Rd
- 8606 Patton Rd
- 8612 Patton Rd
- 1203 Claridge Rd
- 8604 Patton Rd
- 1204 Claridge Rd
- 8614 Patton Rd
- 8515 Widener Rd
- 8603 Hull Dr
- 8602 Patton Rd
- 1202 Claridge Rd
- 1201 Claridge Rd Unit 67
- 8616 Patton Rd
- 8605 Hull Dr
- 8512 Widener Rd