Estimated Value: $344,000 - $575,000
--
Bed
3
Baths
1,819
Sq Ft
$244/Sq Ft
Est. Value
About This Home
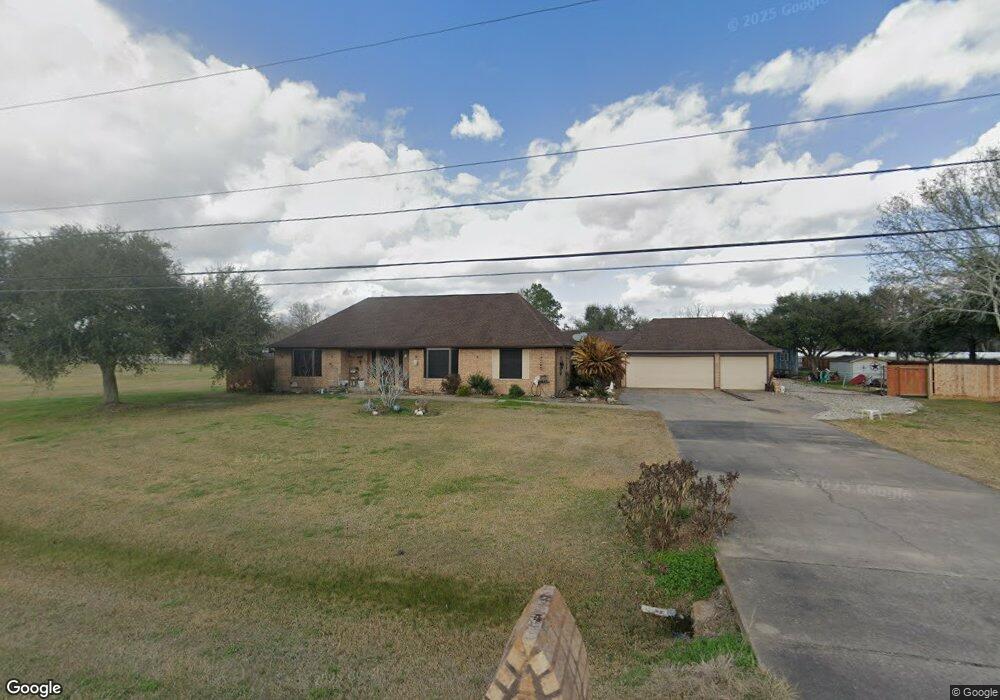
This home is located at 1209 County Road 634, Alvin, TX 77511 and is currently estimated at $443,609, approximately $243 per square foot. 1209 County Road 634 is a home located in Brazoria County with nearby schools including Hood-Case Elementary School, G.W. Harby Junior High School, and Alvin High School.
Ownership History
Date
Name
Owned For
Owner Type
Purchase Details
Closed on
Jan 8, 2021
Sold by
Mcgaughey Patrick and Mcgaughey Stephanie
Bought by
Stockton Kinnan
Current Estimated Value
Home Financials for this Owner
Home Financials are based on the most recent Mortgage that was taken out on this home.
Original Mortgage
$151,683
Outstanding Balance
$143,493
Interest Rate
7.25%
Mortgage Type
Stand Alone First
Estimated Equity
$300,116
Purchase Details
Closed on
Dec 13, 2005
Sold by
Joseph Nancy Leigh
Bought by
Ryan Daryl W and Ryan Kelly Ann
Home Financials for this Owner
Home Financials are based on the most recent Mortgage that was taken out on this home.
Original Mortgage
$119,000
Interest Rate
6.29%
Mortgage Type
Fannie Mae Freddie Mac
Purchase Details
Closed on
May 21, 2003
Sold by
Joseph David Wayne
Bought by
Joseph Nancy Leigh
Create a Home Valuation Report for This Property
The Home Valuation Report is an in-depth analysis detailing your home's value as well as a comparison with similar homes in the area
Home Values in the Area
Average Home Value in this Area
Purchase History
| Date | Buyer | Sale Price | Title Company |
|---|---|---|---|
| Stockton Kinnan | -- | Alamo Title Company | |
| Ryan Daryl W | -- | Chicago Title Insurance Comp | |
| Joseph Nancy Leigh | -- | -- |
Source: Public Records
Mortgage History
| Date | Status | Borrower | Loan Amount |
|---|---|---|---|
| Open | Stockton Kinnan | $151,683 | |
| Previous Owner | Ryan Daryl W | $119,000 | |
| Closed | Joseph Nancy Leigh | $0 |
Source: Public Records
Tax History Compared to Growth
Tax History
| Year | Tax Paid | Tax Assessment Tax Assessment Total Assessment is a certain percentage of the fair market value that is determined by local assessors to be the total taxable value of land and additions on the property. | Land | Improvement |
|---|---|---|---|---|
| 2025 | $5,538 | $417,854 | $189,000 | $277,240 |
| 2023 | $5,538 | $345,334 | $189,000 | $260,031 |
| 2022 | $6,689 | $313,940 | $151,200 | $222,400 |
| 2021 | $6,333 | $285,400 | $135,000 | $150,400 |
| 2020 | $6,268 | $316,660 | $90,000 | $226,660 |
| 2019 | $5,866 | $253,370 | $60,000 | $193,370 |
| 2018 | $5,719 | $246,420 | $60,000 | $186,420 |
| 2017 | $5,320 | $226,470 | $60,000 | $166,470 |
| 2016 | $5,136 | $218,650 | $33,150 | $185,500 |
| 2014 | $4,073 | $191,650 | $25,500 | $166,150 |
Source: Public Records
Map
Nearby Homes
- 1695 County Road 965
- 1690 County Road 965
- 2257 County Road 529
- 1236 County Road 634
- 1513 County Road 149
- 0 Cardinal Dr
- 1871 County Road 936
- 1688 County Road 144
- 1259 County Road 147
- 1816 County Road 936b
- 3046 County Road 529
- 1290 County Road 145
- 1153 County Road 150
- 2518 W Highway 6
- 3245 W Highway 6
- 925 County Road 737b
- 1663 Morgan Trail Dr
- 1494 Foshee Ct
- 1480 Foshee Ct
- 1025 Luke Dr
- 132 Woodridge Cir
- 1223 County Road 634
- 1192 County Road 634
- 1641 County Road 965
- 1649 County Road 965
- 1189 County Road 634
- 0 County Road 965 Unit 92221954
- 1233 County Road 634
- 1637 County Road 965
- 1657 County Road 965
- 1158 County Road 634
- 1245 County Road 634
- 1245 County Road 634
- 1171 County Road 634
- 2251 County Road 529
- 1679 County Road 965
- 1638 County Road 965
- 1144 County Road 634
- 127 Woodridge Cir
- 1334 County Road 634