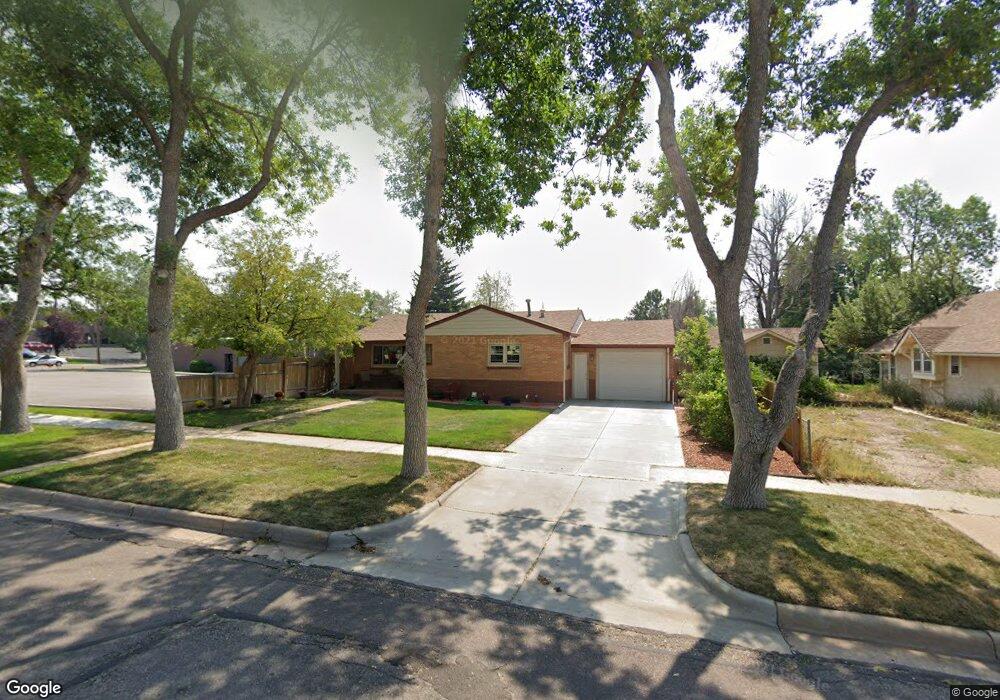
1209 E 21st St Cheyenne, WY 82001
Historic Cheyenne NeighborhoodEstimated Value: $322,000 - $345,211
4
Beds
2
Baths
996
Sq Ft
$331/Sq Ft
Est. Value
About This Home
This home is located at 1209 E 21st St, Cheyenne, WY 82001 and is currently estimated at $329,553, approximately $330 per square foot. 1209 E 21st St is a home located in Laramie County with nearby schools including Alta Vista Elementary School, Carey Junior High School, and East High School.
Ownership History
Date
Name
Owned For
Owner Type
Purchase Details
Closed on
Aug 3, 2020
Sold by
Lopez Daniel and Lopez Tracy
Bought by
Rudloff Susan J and Moore Rebecca H
Current Estimated Value
Purchase Details
Closed on
Apr 29, 2008
Sold by
Lopez Daniel and Lopez Tracey
Bought by
Lopez Daniel and Lopez Tracey
Home Financials for this Owner
Home Financials are based on the most recent Mortgage that was taken out on this home.
Original Mortgage
$142,100
Interest Rate
5.84%
Mortgage Type
New Conventional
Purchase Details
Closed on
Apr 20, 2006
Sold by
Guardian Development Of Wyoming Llc
Bought by
Lopez Daniel and Lopez Tracy
Home Financials for this Owner
Home Financials are based on the most recent Mortgage that was taken out on this home.
Original Mortgage
$27,800
Interest Rate
6.36%
Mortgage Type
Stand Alone Second
Create a Home Valuation Report for This Property
The Home Valuation Report is an in-depth analysis detailing your home's value as well as a comparison with similar homes in the area
Home Values in the Area
Average Home Value in this Area
Purchase History
| Date | Buyer | Sale Price | Title Company |
|---|---|---|---|
| Rudloff Susan J | -- | Laramie Cnty Abstract & Ttl | |
| Lopez Daniel | -- | None Available | |
| Lopez Daniel | -- | None Available |
Source: Public Records
Mortgage History
| Date | Status | Borrower | Loan Amount |
|---|---|---|---|
| Previous Owner | Lopez Daniel | $142,100 | |
| Previous Owner | Lopez Daniel | $27,800 | |
| Previous Owner | Lopez Daniel | $111,200 |
Source: Public Records
Tax History
| Year | Tax Paid | Tax Assessment Tax Assessment Total Assessment is a certain percentage of the fair market value that is determined by local assessors to be the total taxable value of land and additions on the property. | Land | Improvement |
|---|---|---|---|---|
| 2025 | $2,239 | $24,129 | $2,220 | $21,909 |
| 2024 | $2,239 | $31,659 | $2,960 | $28,699 |
| 2023 | $2,161 | $30,556 | $2,960 | $27,596 |
| 2022 | $1,882 | $26,073 | $2,960 | $23,113 |
| 2021 | $1,740 | $24,049 | $2,960 | $21,089 |
| 2020 | $1,530 | $21,209 | $2,960 | $18,249 |
| 2019 | $1,458 | $20,187 | $2,960 | $17,227 |
| 2018 | $1,324 | $18,514 | $2,526 | $15,988 |
| 2017 | $1,223 | $16,946 | $2,526 | $14,420 |
| 2016 | $1,158 | $16,035 | $2,458 | $13,577 |
| 2015 | $1,098 | $15,196 | $2,458 | $12,738 |
| 2014 | $1,097 | $15,095 | $2,458 | $12,637 |
Source: Public Records
Map
Nearby Homes
- 1018 E 20th St
- 2013 Dunn Ave
- 1406 E 19th St
- 1717 Alexander Ave Unit 302
- 1608 E 21st St
- 1410 E 17th St
- 802 E 18th St
- 1014 E 25th St Unit 203
- 1510 Seymour Ave
- 3341 Dunn Ave
- 1120 Black Ct
- 1605 E 16th St
- 1902 Cheyenne Place
- 701 E Lincolnway
- TBD Charles St
- 714 E 15th St
- 3529 Amherst Rd
- 1911 E 17th St
- 414 E 22nd St
- 1906 E 21st St
- 1201 E 21st St
- 1214 E 21st St
- 1214 E 21st St Unit Duff
- 2103 Duff Ave
- 1218 E 21st St
- 1123 E 21st St
- 1220 E 21st St
- 2010 Duff Ave
- 2012 Duff Ave
- 1122 E 21st St
- 1119 E 21st St
- 1122 E 20th St
- 2110 Duff Ave
- 2019 Alexander Ave
- 1116 E 20th St
- 1209 E 22nd St
- 1205 E 22nd St
- 1109 E 21st St
- 1215 E 22nd St
- 1201 E 22nd St
Your Personal Tour Guide
Ask me questions while you tour the home.