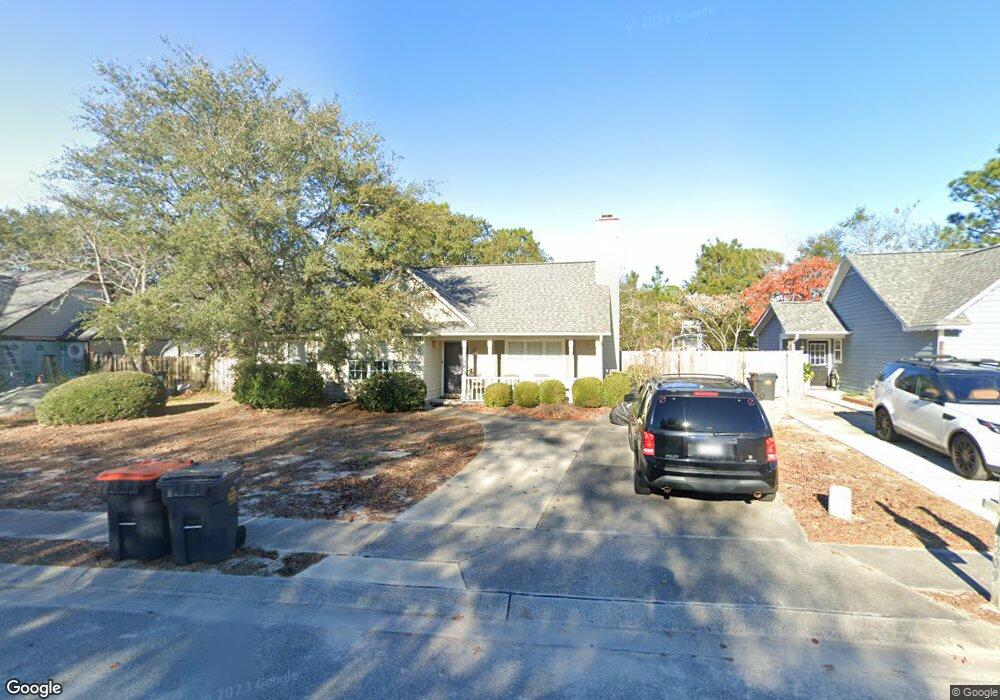
1209 Faulkenberry Rd Wilmington, NC 28409
Estimated Value: $339,363 - $363,000
3
Beds
2
Baths
1,286
Sq Ft
$271/Sq Ft
Est. Value
About This Home
This home is located at 1209 Faulkenberry Rd, Wilmington, NC 28409 and is currently estimated at $348,341, approximately $270 per square foot. 1209 Faulkenberry Rd is a home located in New Hanover County with nearby schools including Edwin A. Anderson Elementary School, Charles P. Murray Middle School, and Eugene Ashley High School.
Ownership History
Date
Name
Owned For
Owner Type
Purchase Details
Closed on
Feb 26, 2016
Sold by
Pour Hossein and Pour Hossein D
Bought by
Pour Hossein D and Pour Diane G
Current Estimated Value
Home Financials for this Owner
Home Financials are based on the most recent Mortgage that was taken out on this home.
Original Mortgage
$141,000
Outstanding Balance
$111,889
Interest Rate
3.81%
Mortgage Type
New Conventional
Estimated Equity
$236,452
Purchase Details
Closed on
Feb 16, 1996
Sold by
Fore David B Natalie H
Bought by
Pour Hossein
Purchase Details
Closed on
Jan 28, 1994
Sold by
Landmark Homes Inc
Bought by
Fore David B Natalie H
Purchase Details
Closed on
Sep 27, 1993
Sold by
Landmark Developers Inc
Bought by
Landmark Homes Inc
Purchase Details
Closed on
Mar 12, 1993
Sold by
Gps Inc
Bought by
Landmark Developers Inc
Purchase Details
Closed on
Mar 8, 1993
Sold by
Landmark Organization Inc
Bought by
Gps Inc
Purchase Details
Closed on
Feb 28, 1992
Sold by
Wilmington Properties
Bought by
Landmark Organization
Create a Home Valuation Report for This Property
The Home Valuation Report is an in-depth analysis detailing your home's value as well as a comparison with similar homes in the area
Home Values in the Area
Average Home Value in this Area
Purchase History
| Date | Buyer | Sale Price | Title Company |
|---|---|---|---|
| Pour Hossein D | -- | None Available | |
| Pour Hossein | $92,500 | -- | |
| Fore David B Natalie H | $91,500 | -- | |
| Landmark Homes Inc | -- | -- | |
| Landmark Developers Inc | -- | -- | |
| Gps Inc | $6,775,000 | -- | |
| Landmark Organization | $798,000 | -- |
Source: Public Records
Mortgage History
| Date | Status | Borrower | Loan Amount |
|---|---|---|---|
| Open | Pour Hossein D | $141,000 |
Source: Public Records
Tax History Compared to Growth
Tax History
| Year | Tax Paid | Tax Assessment Tax Assessment Total Assessment is a certain percentage of the fair market value that is determined by local assessors to be the total taxable value of land and additions on the property. | Land | Improvement |
|---|---|---|---|---|
| 2025 | $1,183 | $332,000 | $109,200 | $222,800 |
| 2023 | $1,183 | $212,400 | $63,100 | $149,300 |
| 2022 | $1,188 | $212,400 | $63,100 | $149,300 |
| 2021 | $1,175 | $212,400 | $63,100 | $149,300 |
| 2020 | $932 | $147,400 | $40,000 | $107,400 |
| 2019 | $928 | $146,700 | $40,000 | $106,700 |
| 2018 | $928 | $146,700 | $40,000 | $106,700 |
| 2017 | $950 | $146,700 | $40,000 | $106,700 |
| 2016 | $875 | $126,300 | $40,000 | $86,300 |
| 2015 | $813 | $126,300 | $40,000 | $86,300 |
| 2014 | $799 | $126,300 | $40,000 | $86,300 |
Source: Public Records
Map
Nearby Homes
- 6412 Stearman Ct
- 6309 Iverstone Ct
- 122 Heathcliff Rd
- 1409 Faulkenberry Rd
- 1302 Grove Point Rd
- 4004 Winds Ridge Dr
- 7100 Kinsella Ct
- 4024 Hons Trail
- 213 Country Place Rd
- 6302 Chissom Rd
- 1003 Windgate Dr
- 6546 Carolina Beach
- 6661 Carolina Beach
- 6556 Carolina Beach
- 6231 Carolina Beach
- 6617 Sago Palm Dr
- 6634 Carolina Beach
- 1016 Fawn Valley Way
- 1040 Fawn Valley Way
- 1004 Fawn Valley Walk
- 1207 Faulkenberry Rd
- 1211 Faulkenberry Rd
- 6308 Stearman Ct
- 6306 Stearman Ct
- 1205 Faulkenberry Rd
- 1213 Faulkenberry Rd
- 6312 Stearman Ct
- 1208 Faulkenberry Rd
- 6304 Stearman Ct
- 1206 Faulkenberry Rd
- 1210 Faulkenberry Rd
- 6314 Stearman Ct
- 1203 Faulkenberry Rd
- 1204 Faulkenberry Rd
- 1215 Faulkenberry Rd
- 6302 Stearman Ct
- 1214 Faulkenberry Rd
- 1201 Faulkenberry Rd
- 6408 Stearman Ct
- 1128 Welborn Rd