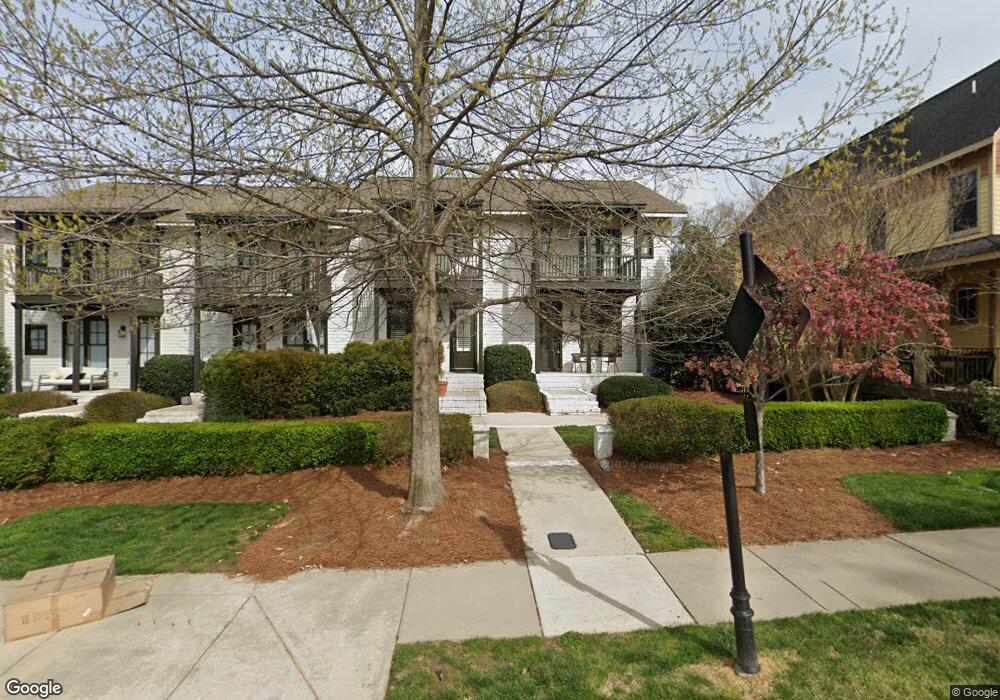
1209 Great Ridge Pkwy Chapel Hill, NC 27516
Estimated Value: $330,808 - $385,000
2
Beds
3
Baths
1,350
Sq Ft
$269/Sq Ft
Est. Value
About This Home
This home is located at 1209 Great Ridge Pkwy, Chapel Hill, NC 27516 and is currently estimated at $362,952, approximately $268 per square foot. 1209 Great Ridge Pkwy is a home located in Chatham County with nearby schools including Margaret B. Pollard Middle School, Woods Charter, and Holy Youth Christian Academy.
Ownership History
Date
Name
Owned For
Owner Type
Purchase Details
Closed on
Feb 12, 2019
Sold by
Ferguson Heather H and Lewis Nancy T
Bought by
Chelius Gabriel and Chelius Alissa
Current Estimated Value
Home Financials for this Owner
Home Financials are based on the most recent Mortgage that was taken out on this home.
Original Mortgage
$163,100
Outstanding Balance
$142,810
Interest Rate
4.4%
Mortgage Type
New Conventional
Estimated Equity
$220,142
Purchase Details
Closed on
Aug 19, 2010
Sold by
Saussy Burbank Llc
Bought by
Ferguson Heather H and Lewis Nancy T
Home Financials for this Owner
Home Financials are based on the most recent Mortgage that was taken out on this home.
Original Mortgage
$196,571
Interest Rate
4.59%
Mortgage Type
FHA
Create a Home Valuation Report for This Property
The Home Valuation Report is an in-depth analysis detailing your home's value as well as a comparison with similar homes in the area
Home Values in the Area
Average Home Value in this Area
Purchase History
| Date | Buyer | Sale Price | Title Company |
|---|---|---|---|
| Chelius Gabriel | $233,000 | None Available | |
| Ferguson Heather H | $199,500 | None Available |
Source: Public Records
Mortgage History
| Date | Status | Borrower | Loan Amount |
|---|---|---|---|
| Open | Chelius Gabriel | $163,100 | |
| Previous Owner | Ferguson Heather H | $196,571 |
Source: Public Records
Tax History Compared to Growth
Tax History
| Year | Tax Paid | Tax Assessment Tax Assessment Total Assessment is a certain percentage of the fair market value that is determined by local assessors to be the total taxable value of land and additions on the property. | Land | Improvement |
|---|---|---|---|---|
| 2025 | $2,385 | $317,404 | $50,000 | $267,404 |
| 2024 | $2,385 | $247,794 | $48,000 | $199,794 |
| 2023 | $2,015 | $247,794 | $48,000 | $199,794 |
| 2022 | $2,065 | $247,794 | $48,000 | $199,794 |
| 2021 | $0 | $247,811 | $48,000 | $199,811 |
| 2020 | $1,965 | $236,448 | $25,000 | $211,448 |
| 2019 | $1,965 | $236,448 | $25,000 | $211,448 |
| 2018 | $1,882 | $236,448 | $25,000 | $211,448 |
| 2017 | $1,883 | $236,448 | $25,000 | $211,448 |
| 2016 | $1,627 | $197,968 | $25,000 | $172,968 |
| 2015 | $1,611 | $197,968 | $25,000 | $172,968 |
| 2014 | -- | $197,968 | $25,000 | $172,968 |
| 2013 | -- | $197,968 | $25,000 | $172,968 |
Source: Public Records
Map
Nearby Homes
- 1168 Great Ridge Pkwy
- 347 Dark Forest Dr
- 265 Tobacco Farm Way
- 44 Owen Towne Rd
- 38 Owen Towne Rd
- 610 Bennett Mountain Trace
- 1420 Briar Chapel Pkwy
- 59 Tobacco Farm Way
- 157 Wildwind Dr
- 386 Monteith Dr
- 136 Serenity Hill Cir
- 51 Cliffdale Rd
- 614 Great Ridge Pkwy
- 66 Ashwood Dr
- 540 Patterson Dr
- 586 Great Ridge Pkwy
- 560 Great Ridge Pkwy
- 556 Great Ridge Pkwy
- 40 Mallard Landing Dr
- 39 Monteith Dr
- 1203 Great Ridge Pkwy
- 1217 Great Ridge Pkwy
- 1199 Great Ridge Pkwy
- 1223 Great Ridge Pkwy
- 1181 Great Ridge Pkwy
- 1229 Great Ridge Pkwy
- 1177 Great Ridge Pkwy
- 1235 Great Ridge Pkwy
- 1239 Great Ridge Pkwy
- 1169 Great Ridge Pkwy
- 1165 Great Ridge Pkwy
- 1157 Great Ridge Pkwy
- 1214 Great Ridge Pkwy
- 1190 Great Ridge Pkwy
- 1188 Great Ridge Pkwy
- 1194 Great Ridge Pkwy
- 1155 Great Ridge Pkwy
- 1222 Great Ridge Pkwy
- 1253 Great Ridge Pkwy
- 1234 Great Ridge Pkwy