Estimated Value: $124,000 - $146,000
3
Beds
2
Baths
1,750
Sq Ft
$76/Sq Ft
Est. Value
About This Home
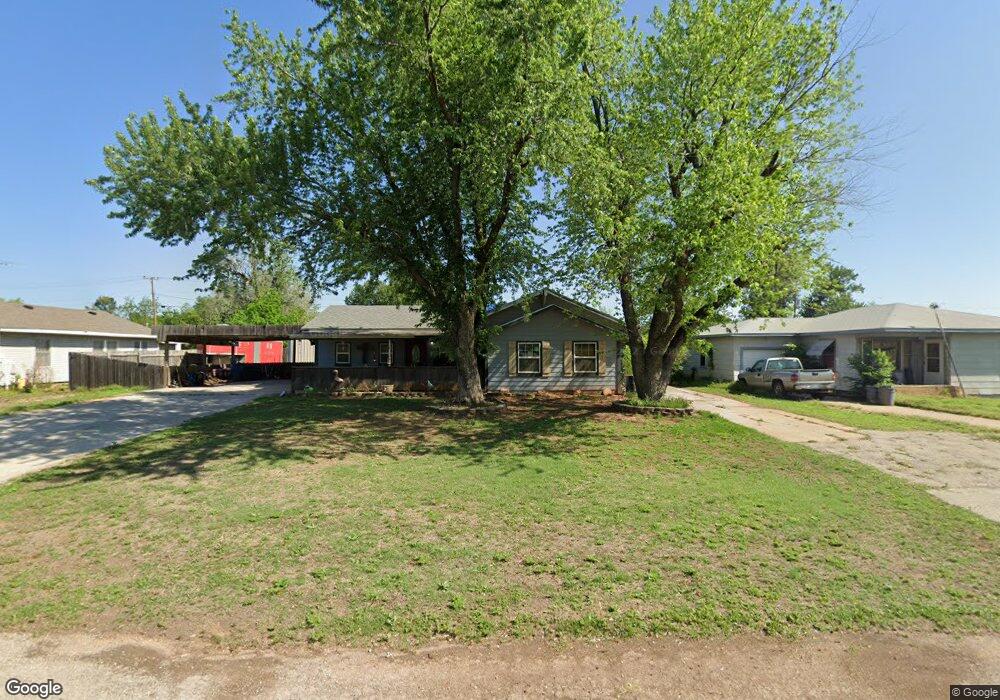
This home is located at 1209 Holly St, Perry, OK 73077 and is currently estimated at $133,040, approximately $76 per square foot. 1209 Holly St is a home located in Noble County with nearby schools including Perry Elementary School and Perry High School.
Ownership History
Date
Name
Owned For
Owner Type
Purchase Details
Closed on
Jan 28, 2008
Sold by
Price Betty L and Price Bill R
Bought by
Bornt Bobby
Current Estimated Value
Purchase Details
Closed on
Jun 2, 2003
Sold by
Bobby L Bornt
Bought by
Bobby L Bornt
Purchase Details
Closed on
Aug 31, 2001
Sold by
Jared C Levalley
Bought by
Bobby L Bornt
Purchase Details
Closed on
May 7, 1996
Sold by
John D Deken
Bought by
Jared C Levalley
Purchase Details
Closed on
Jul 3, 1990
Sold by
Gene C Wood
Bought by
John D Deken
Create a Home Valuation Report for This Property
The Home Valuation Report is an in-depth analysis detailing your home's value as well as a comparison with similar homes in the area
Home Values in the Area
Average Home Value in this Area
Purchase History
| Date | Buyer | Sale Price | Title Company |
|---|---|---|---|
| Bornt Bobby | $12,500 | None Available | |
| Bobby L Bornt | -- | -- | |
| Bobby L Bornt | $29,000 | -- | |
| Jared C Levalley | $16,100 | -- | |
| John D Deken | -- | -- |
Source: Public Records
Tax History Compared to Growth
Tax History
| Year | Tax Paid | Tax Assessment Tax Assessment Total Assessment is a certain percentage of the fair market value that is determined by local assessors to be the total taxable value of land and additions on the property. | Land | Improvement |
|---|---|---|---|---|
| 2025 | $922 | $9,735 | $388 | $9,347 |
| 2024 | $922 | $9,272 | $388 | $8,884 |
| 2023 | $866 | $8,830 | $388 | $8,442 |
| 2022 | $825 | $8,410 | $388 | $8,022 |
| 2021 | $860 | $8,410 | $388 | $8,022 |
| 2020 | $806 | $7,628 | $388 | $7,240 |
| 2019 | $753 | $7,441 | $388 | $7,053 |
| 2018 | $773 | $7,467 | $345 | $7,122 |
| 2017 | $758 | $7,459 | $345 | $7,114 |
| 2016 | $772 | $7,673 | $483 | $7,190 |
| 2015 | $655 | $7,308 | $483 | $6,825 |
| 2014 | $639 | $7,095 | $483 | $6,612 |
Source: Public Records
Map
Nearby Homes