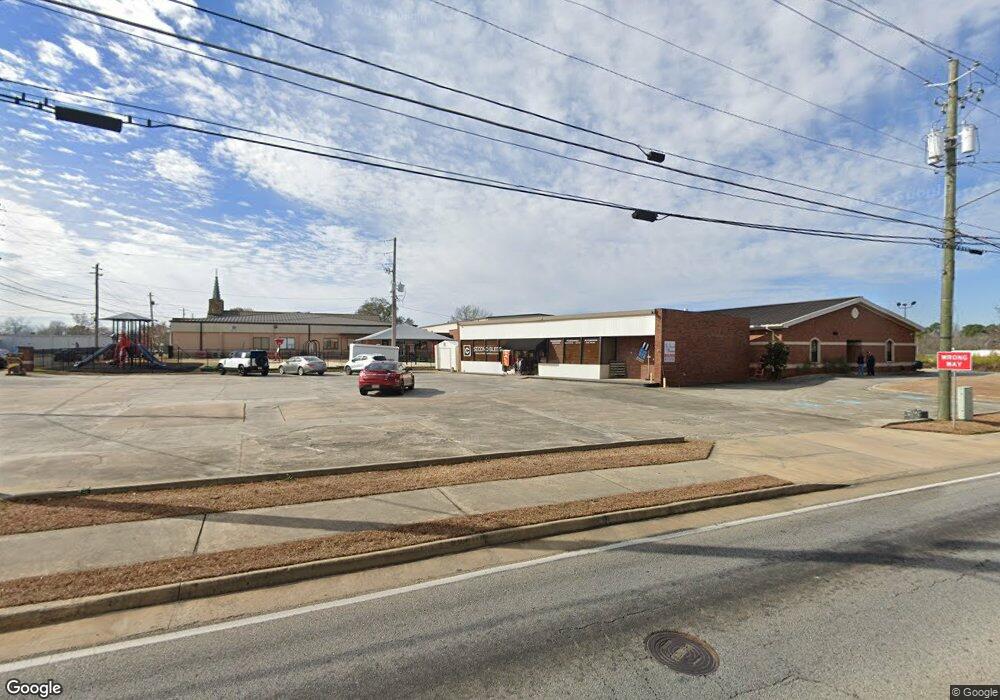
1209 Loop Rd Vidalia, GA 30474
Estimated Value: $152,000 - $195,000
Studio
2
Baths
1,553
Sq Ft
$112/Sq Ft
Est. Value
About This Home
This home is located at 1209 Loop Rd, Vidalia, GA 30474 and is currently estimated at $173,964, approximately $112 per square foot. 1209 Loop Rd is a home located in Toombs County with nearby schools including J.D. Dickerson Primary School, Sally Dailey Meadows Elementary School, and J.R. Trippe Middle School.
Ownership History
Date
Name
Owned For
Owner Type
Purchase Details
Closed on
Feb 19, 2016
Sold by
Hodges George Lindsey
Bought by
Hodges Ricky Michael and Hodges Diane Reese
Current Estimated Value
Home Financials for this Owner
Home Financials are based on the most recent Mortgage that was taken out on this home.
Original Mortgage
$49,758
Interest Rate
3.81%
Mortgage Type
New Conventional
Purchase Details
Closed on
Oct 31, 2012
Sold by
Hodges Laurie D
Bought by
Hodges George Lindsey and Hodges Ricky Michael
Purchase Details
Closed on
Jul 16, 2010
Sold by
Hodges George Lindsey
Bought by
Hodges George Harold and Hodges Laurie D
Purchase Details
Closed on
Apr 28, 2009
Sold by
Hodges George Harold
Bought by
Hodges George Lindsey and Hodges Ricky Michael
Purchase Details
Closed on
Nov 11, 2004
Sold by
Hodges George Harold
Bought by
Hodges George Harold and Hodges Laurie D
Purchase Details
Closed on
Oct 29, 1997
Bought by
Hodges George Harold
Create a Home Valuation Report for This Property
The Home Valuation Report is an in-depth analysis detailing your home's value as well as a comparison with similar homes in the area
Home Values in the Area
Average Home Value in this Area
Purchase History
| Date | Buyer | Sale Price | Title Company |
|---|---|---|---|
| Hodges Ricky Michael | $48,000 | -- | |
| Hodges George Lindsey | -- | -- | |
| Hodges George Harold | -- | -- | |
| Hodges George Lindsey | -- | -- | |
| Hodges George Harold | -- | -- | |
| Hodges George Harold | -- | -- |
Source: Public Records
Mortgage History
| Date | Status | Borrower | Loan Amount |
|---|---|---|---|
| Closed | Hodges Ricky Michael | $49,758 |
Source: Public Records
Tax History
| Year | Tax Paid | Tax Assessment Tax Assessment Total Assessment is a certain percentage of the fair market value that is determined by local assessors to be the total taxable value of land and additions on the property. | Land | Improvement |
|---|---|---|---|---|
| 2025 | $1,072 | $67,005 | $5,012 | $61,993 |
| 2024 | $1,100 | $67,005 | $5,012 | $61,993 |
| 2023 | $1,120 | $64,551 | $5,012 | $59,539 |
| 2022 | $359 | $57,542 | $5,012 | $52,530 |
| 2021 | $362 | $45,253 | $5,012 | $40,241 |
| 2020 | $366 | $42,832 | $5,012 | $37,820 |
| 2019 | $366 | $42,832 | $5,012 | $37,820 |
| 2018 | $365 | $42,832 | $5,012 | $37,820 |
| 2017 | $375 | $40,466 | $5,012 | $35,454 |
| 2016 | $367 | $39,685 | $5,012 | $34,673 |
| 2015 | -- | $34,380 | $5,012 | $29,368 |
| 2014 | -- | $34,381 | $5,012 | $29,368 |
Source: Public Records
Map
Nearby Homes
- 1407 Loop Rd
- 801 Warthen St
- 900 High St
- 0 Hwy 292 Unit 20251
- 1109 5th Ave
- 1813 Loop Rd
- 805 Brantley Rd
- 209 Lively St
- 0 Tommie Dr
- 00 Meadowbrook St
- 209 Montgomery St
- 1407 N Cheney Dr
- 1303 Meadows Ln
- 1204 Cadillac Dr
- 1200 Cadillac Dr
- 1508 N Cheney Dr
- 273 Country Estates Blvd
- 709 Winona St
- 406 W 3rd St
- 710 Smith St
Your Personal Tour Guide
Ask me questions while you tour the home.