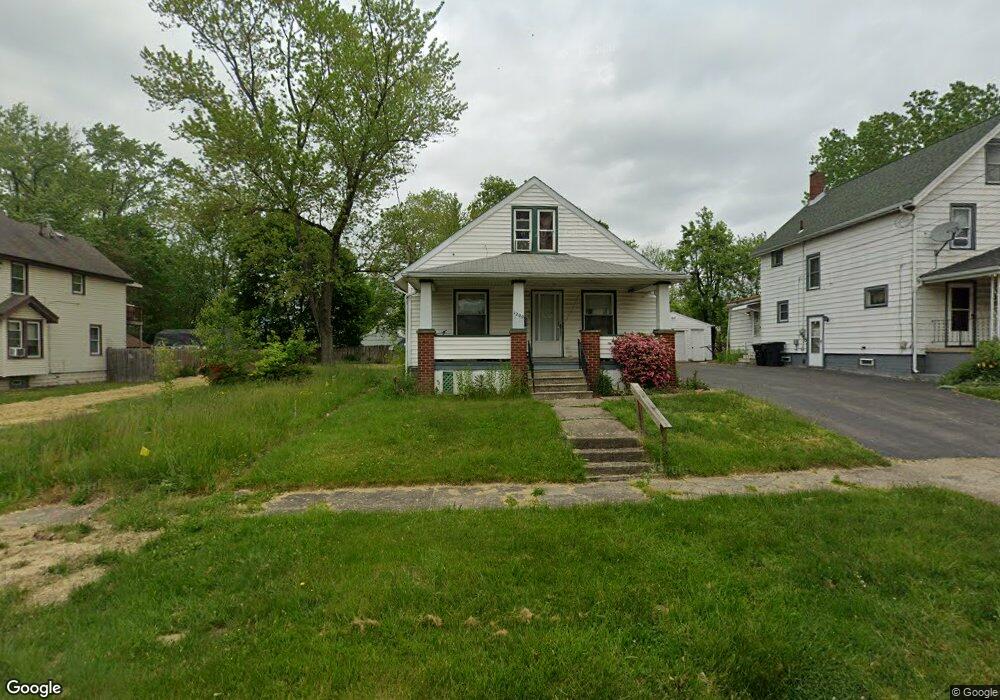
1209 Mckinley St NE Warren, OH 44483
Harding NeighborhoodEstimated Value: $48,000 - $66,000
2
Beds
1
Bath
848
Sq Ft
$66/Sq Ft
Est. Value
About This Home
This home is located at 1209 Mckinley St NE, Warren, OH 44483 and is currently estimated at $55,729, approximately $65 per square foot. 1209 Mckinley St NE is a home located in Trumbull County with nearby schools including Warren G. Harding High School, Lincoln PK-8 School, and Steam Academy of Warren.
Ownership History
Date
Name
Owned For
Owner Type
Purchase Details
Closed on
Jul 7, 2022
Sold by
Cbw Enterprises Llc
Bought by
Dth Resources Llc
Current Estimated Value
Purchase Details
Closed on
Apr 15, 2022
Sold by
Tag Resources Llc
Bought by
Cbw Enterprises Llc
Home Financials for this Owner
Home Financials are based on the most recent Mortgage that was taken out on this home.
Interest Rate
5%
Purchase Details
Closed on
Mar 13, 2015
Sold by
Funtulis George and Funtulis Sophia
Bought by
Tag Resources Llc
Purchase Details
Closed on
Jul 5, 2005
Sold by
Genkis George P and Gentis Demetra
Bought by
Funtulis George and Funtulis Sophia
Purchase Details
Closed on
Jun 28, 2005
Sold by
Genkis George P and Gentis Demetra
Bought by
Funtulis George and Funtulis Sophia
Purchase Details
Closed on
Mar 4, 1994
Sold by
Macris Panagiota
Bought by
Demetra George P and Demetra Gentis S
Purchase Details
Closed on
Jan 1, 1990
Bought by
Panagiota Macris
Create a Home Valuation Report for This Property
The Home Valuation Report is an in-depth analysis detailing your home's value as well as a comparison with similar homes in the area
Home Values in the Area
Average Home Value in this Area
Purchase History
| Date | Buyer | Sale Price | Title Company |
|---|---|---|---|
| Dth Resources Llc | -- | Burkey Burkey And Cher Co Lpa | |
| Cbw Enterprises Llc | $32,000 | -- | |
| Tag Resources Llc | $18,000 | None Available | |
| Funtulis George | -- | -- | |
| Funtulis George | -- | -- | |
| Demetra George P | $30,000 | -- | |
| Panagiota Macris | -- | -- |
Source: Public Records
Mortgage History
| Date | Status | Borrower | Loan Amount |
|---|---|---|---|
| Previous Owner | Funtulis George | -- |
Source: Public Records
Tax History Compared to Growth
Tax History
| Year | Tax Paid | Tax Assessment Tax Assessment Total Assessment is a certain percentage of the fair market value that is determined by local assessors to be the total taxable value of land and additions on the property. | Land | Improvement |
|---|---|---|---|---|
| 2024 | $569 | $11,240 | $1,720 | $9,520 |
| 2023 | $569 | $11,240 | $1,720 | $9,520 |
| 2022 | $470 | $7,250 | $1,720 | $5,530 |
| 2021 | $471 | $7,250 | $1,720 | $5,530 |
| 2020 | $471 | $7,250 | $1,720 | $5,530 |
| 2019 | $456 | $6,660 | $1,720 | $4,940 |
| 2018 | $454 | $6,660 | $1,720 | $4,940 |
| 2017 | $447 | $6,660 | $1,720 | $4,940 |
| 2016 | $670 | $10,330 | $2,520 | $7,810 |
| 2015 | $666 | $10,330 | $2,520 | $7,810 |
| 2014 | $662 | $10,330 | $2,520 | $7,810 |
| 2013 | $675 | $11,100 | $2,520 | $8,580 |
Source: Public Records
Map
Nearby Homes
- 351 Laird Ave NE
- 265 Charles Ave NE
- 151 Bonnie Brae Ave NE
- 318 Fairmount Ave NE
- 210 Fairmount Ave NE
- 1250 Grant St SE
- 424 Kenilworth Ave NE
- 257 Iddings Ave SE
- 356 Laird Ave SE
- 159 Kenilworth Ave SE
- 1253 Belle St SE
- 433 Olive Ave NE Unit 435
- 978 Hollywood St NE
- 1554 Edgewood St NE
- 246 Oak Knoll Ave SE
- 1475 Hollywood St NE
- 442 Belmont Ave NE
- 564 Adelaide Ave NE
- 451 Homewood Ave SE
- 1815 Atlantic St NE
- 1201 Mckinley St NE
- 1217 Mckinley St NE
- 1195 Mckinley St NE
- 1227 Mckinley St NE
- 1189 Mckinley St NE
- 1235 Mckinley St NE
- 1216 Woodland St NE
- 1202 Woodland St NE
- 1228 Mckinley St NE
- 1190 Woodland St NE
- 1206 Mckinley St NE
- 1228 Woodland St NE
- 1185 Mckinley St NE
- 1243 Mckinley St NE
- 1216 Mckinley St NE
- 1234 Woodland St NE
- 1224 Woodland St NE
- 1178 Woodland St NE
- 1179 Mckinley St NE
- 1240 Woodland St NE