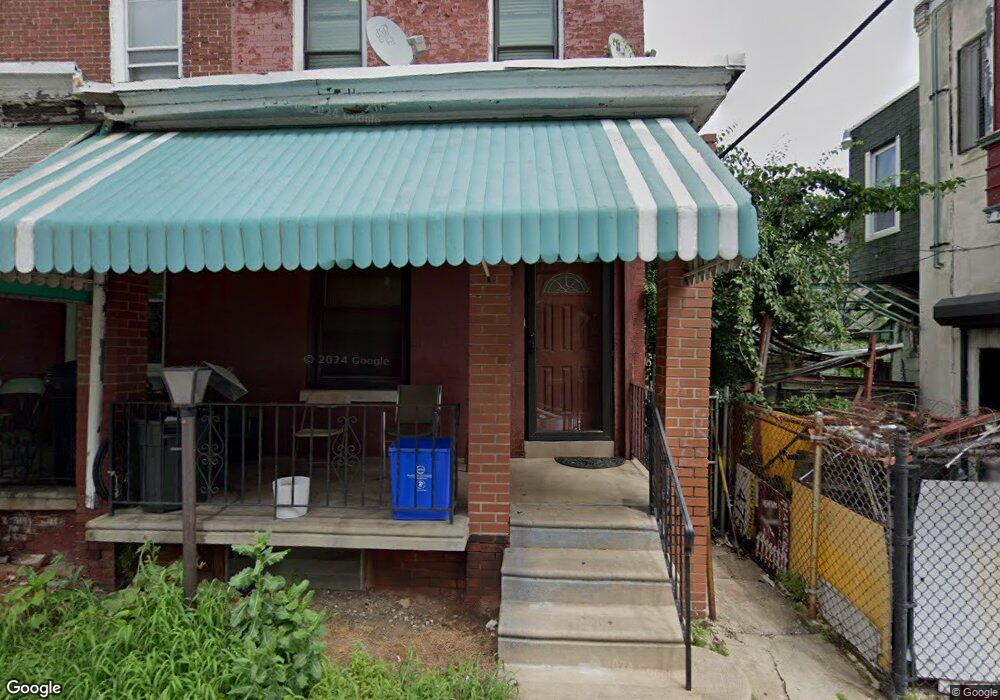
1209 N Wilton St Philadelphia, PA 19131
Carroll Park NeighborhoodEstimated Value: $101,000 - $118,000
3
Beds
1
Bath
1,260
Sq Ft
$88/Sq Ft
Est. Value
About This Home
This home is located at 1209 N Wilton St, Philadelphia, PA 19131 and is currently estimated at $111,333, approximately $88 per square foot. 1209 N Wilton St is a home located in Philadelphia County with nearby schools including Edward Heston School, Overbrook High School, and KIPP West Philadelphia Preparatory Chart.
Ownership History
Date
Name
Owned For
Owner Type
Purchase Details
Closed on
Apr 18, 2007
Sold by
Mckennie Beverly and Mckennie Melanie
Bought by
Lowe Damond J
Current Estimated Value
Home Financials for this Owner
Home Financials are based on the most recent Mortgage that was taken out on this home.
Original Mortgage
$50,880
Outstanding Balance
$30,814
Interest Rate
6.18%
Mortgage Type
Purchase Money Mortgage
Estimated Equity
$80,519
Purchase Details
Closed on
Apr 24, 2003
Sold by
Johnson Gail
Bought by
Mckennie Melanie and Mckennie Beverly
Home Financials for this Owner
Home Financials are based on the most recent Mortgage that was taken out on this home.
Original Mortgage
$40,092
Interest Rate
5.82%
Mortgage Type
FHA
Purchase Details
Closed on
Jun 7, 2002
Sold by
Smith Philip
Bought by
Johnson Gail
Home Financials for this Owner
Home Financials are based on the most recent Mortgage that was taken out on this home.
Original Mortgage
$24,570
Interest Rate
11.75%
Create a Home Valuation Report for This Property
The Home Valuation Report is an in-depth analysis detailing your home's value as well as a comparison with similar homes in the area
Home Values in the Area
Average Home Value in this Area
Purchase History
| Date | Buyer | Sale Price | Title Company |
|---|---|---|---|
| Lowe Damond J | $50,880 | None Available | |
| Mckennie Melanie | $40,000 | -- | |
| Johnson Gail | $27,300 | -- |
Source: Public Records
Mortgage History
| Date | Status | Borrower | Loan Amount |
|---|---|---|---|
| Open | Lowe Damond J | $50,880 | |
| Previous Owner | Mckennie Melanie | $40,092 | |
| Previous Owner | Johnson Gail | $24,570 |
Source: Public Records
Tax History Compared to Growth
Tax History
| Year | Tax Paid | Tax Assessment Tax Assessment Total Assessment is a certain percentage of the fair market value that is determined by local assessors to be the total taxable value of land and additions on the property. | Land | Improvement |
|---|---|---|---|---|
| 2025 | $977 | $94,500 | $18,900 | $75,600 |
| 2024 | $977 | $94,500 | $18,900 | $75,600 |
| 2023 | $977 | $69,800 | $13,960 | $55,840 |
| 2022 | $977 | $69,800 | $13,960 | $55,840 |
| 2021 | $694 | $0 | $0 | $0 |
| 2020 | $694 | $0 | $0 | $0 |
| 2019 | $669 | $0 | $0 | $0 |
| 2018 | $612 | $0 | $0 | $0 |
| 2017 | $612 | $0 | $0 | $0 |
| 2016 | $612 | $0 | $0 | $0 |
| 2015 | $769 | $0 | $0 | $0 |
| 2014 | -- | $57,400 | $4,032 | $53,368 |
| 2012 | -- | $6,400 | $798 | $5,602 |
Source: Public Records
Map
Nearby Homes
- 5214 W Stiles St
- 1676 N Wilton St
- 1655 N Wilton St
- 1657 N Wilton St
- 1252-54 N 52nd St
- 5132 W Stiles St
- 5335 W Girard Ave
- 5325 W Thompson St
- 5113 W Thompson St
- 1217 N 51st St
- 1338 N 52nd St
- 1340 N 52nd St
- 603 N 53rd St
- 5317 Kershaw St
- 635 N 54th St
- 5419 W Girard Ave
- 5404 W Thompson St
- 1319 N 51st St
- 5215 Master St
- 1235 N Conestoga St
- 1211 N Wilton St
- 1213 N Wilton St
- 1215 N Wilton St
- 5215 W Girard Ave Unit 1
- 5215 W Girard Ave Unit 2
- 5215 W Girard Ave
- 5211 W Girard Ave
- 1217 N Wilton St
- 1219 N Wilton St
- 1210 N 52nd St
- 1214 N 52nd St
- 1214 N 52nd St Unit 2
- 1210 N Wilton St
- 1212 N Wilton St
- 1208 N Wilton St
- 1202 N 52nd St
- 1218 N 52nd St
- 1214 N Wilton St
- 1216 N Wilton St
- 1220 N 52nd St