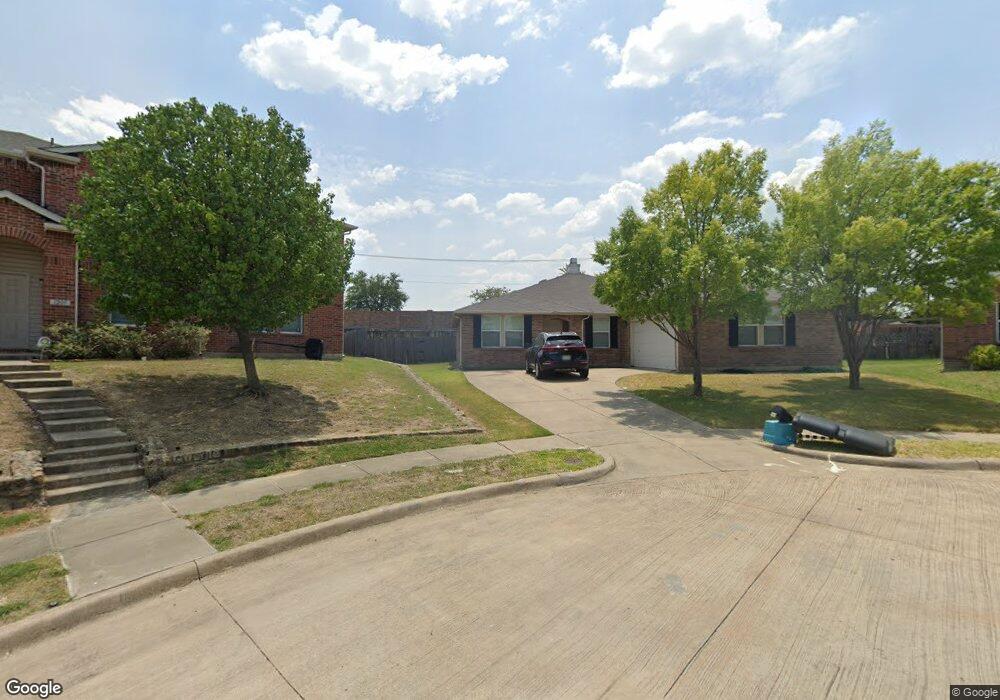
1209 Nimitz Way Mesquite, TX 75181
Tealwood NeighborhoodEstimated Value: $296,000 - $320,000
4
Beds
2
Baths
2,075
Sq Ft
$149/Sq Ft
Est. Value
About This Home
This home is located at 1209 Nimitz Way, Mesquite, TX 75181 and is currently estimated at $310,182, approximately $149 per square foot. 1209 Nimitz Way is a home located in Dallas County with nearby schools including Gentry Elementary School, Berry Middle School, and Horn High School.
Ownership History
Date
Name
Owned For
Owner Type
Purchase Details
Closed on
Nov 30, 2015
Sold by
Smith Ernest and Smith Gloria
Bought by
Rossiter Cynthia A
Current Estimated Value
Home Financials for this Owner
Home Financials are based on the most recent Mortgage that was taken out on this home.
Original Mortgage
$155,138
Outstanding Balance
$124,220
Interest Rate
4.25%
Mortgage Type
FHA
Estimated Equity
$185,962
Purchase Details
Closed on
May 23, 2008
Sold by
Smith Gloria Jean
Bought by
Smith Ernest
Home Financials for this Owner
Home Financials are based on the most recent Mortgage that was taken out on this home.
Original Mortgage
$154,077
Interest Rate
5%
Mortgage Type
VA
Purchase Details
Closed on
Aug 17, 2005
Sold by
Centex Homes
Bought by
Smith Ernest and Smith Gloria J
Home Financials for this Owner
Home Financials are based on the most recent Mortgage that was taken out on this home.
Original Mortgage
$149,251
Interest Rate
5.61%
Mortgage Type
VA
Create a Home Valuation Report for This Property
The Home Valuation Report is an in-depth analysis detailing your home's value as well as a comparison with similar homes in the area
Home Values in the Area
Average Home Value in this Area
Purchase History
| Date | Buyer | Sale Price | Title Company |
|---|---|---|---|
| Rossiter Cynthia A | -- | Attorney | |
| Smith Ernest | -- | None Available | |
| Smith Ernest | -- | -- |
Source: Public Records
Mortgage History
| Date | Status | Borrower | Loan Amount |
|---|---|---|---|
| Open | Rossiter Cynthia A | $155,138 | |
| Previous Owner | Smith Ernest | $154,077 | |
| Previous Owner | Smith Ernest | $149,251 |
Source: Public Records
Tax History Compared to Growth
Tax History
| Year | Tax Paid | Tax Assessment Tax Assessment Total Assessment is a certain percentage of the fair market value that is determined by local assessors to be the total taxable value of land and additions on the property. | Land | Improvement |
|---|---|---|---|---|
| 2025 | $3,926 | $305,520 | $65,000 | $240,520 |
| 2024 | $3,926 | $318,430 | $65,000 | $253,430 |
| 2023 | $3,926 | $297,150 | $65,000 | $232,150 |
| 2022 | $7,466 | $297,150 | $65,000 | $232,150 |
| 2021 | $6,057 | $229,700 | $40,000 | $189,700 |
| 2020 | $5,465 | $195,520 | $35,000 | $160,520 |
| 2019 | $5,691 | $195,520 | $35,000 | $160,520 |
| 2018 | $4,696 | $167,490 | $35,000 | $132,490 |
| 2017 | $4,079 | $145,580 | $30,000 | $115,580 |
| 2016 | $4,079 | $145,580 | $30,000 | $115,580 |
| 2015 | $2,695 | $134,300 | $30,000 | $104,300 |
| 2014 | $2,695 | $99,310 | $30,000 | $69,310 |
Source: Public Records
Map
Nearby Homes
- 2036 Jasper Dr
- 105 Cedar Sage Ln
- 113 Cedar Sage Ln
- 111 Cedar Sage Ln
- 116 Cedar Sage Ln
- 114 Cedar Sage Ln
- 104 Cedar Sage Ln
- 2800 Kerrville Dr
- 1429 Junction Run
- 1428 Nimitz Way
- 118 Sycamore St
- 1033 Burnet Dr
- 115 Whistling Duck Dr
- 112 Woodlands Way
- 121 Red Cedar Ct
- 607 Indian Dr
- 621 Indian Dr
- 121 Emperor Oak Ct
- 111 Whistling Duck Dr
- 109 Whistling Duck Dr
- 1205 Nimitz Way
- 1213 Nimitz Way
- 1201 Nimitz Way
- 1217 Nimitz Way
- 1400 Jasper Dr
- 105 Post Rd
- 1221 Nimitz Way
- 1225 Nimitz Way
- 1404 Jasper Dr
- 90159 Mckenzie Rd
- 2503 Mckenzie Rd
- 950 Mckenzie Rd
- 1200 Nimitz Way
- 1229 Nimitz Way
- 1408 Jasper Dr
- 1201 Junction Run
- 1233 Nimitz Way
- 1204 Nimitz Way
- 111 Post Rd
- 1412 Jasper Dr