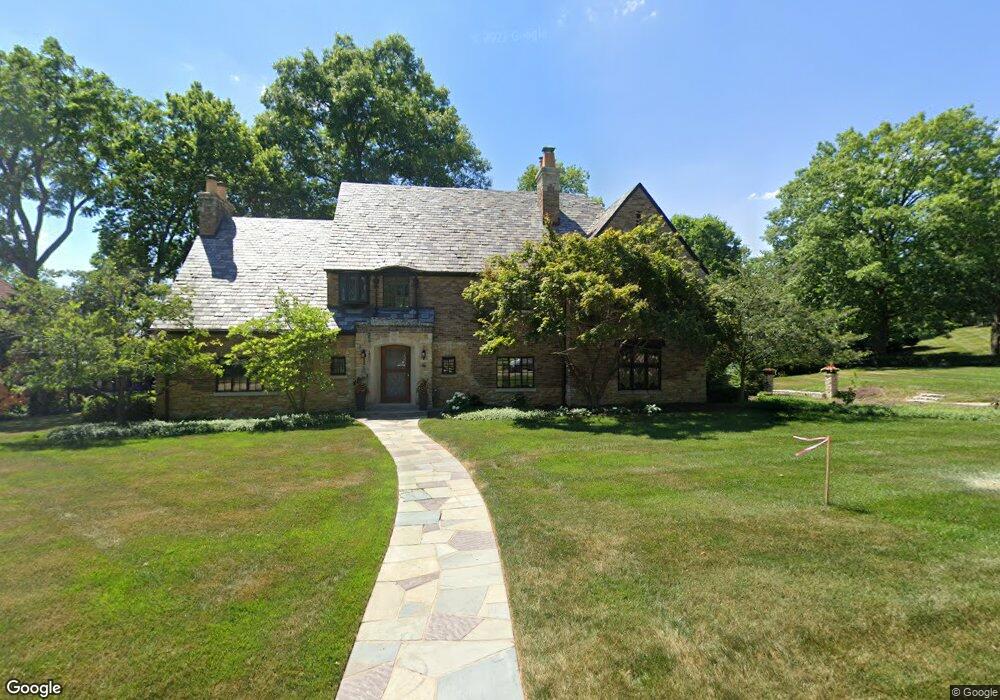
1209 Raleigh Rd Dayton, OH 45419
Estimated Value: $1,115,000 - $1,445,236
4
Beds
5
Baths
5,129
Sq Ft
$244/Sq Ft
Est. Value
About This Home
This home is located at 1209 Raleigh Rd, Dayton, OH 45419 and is currently estimated at $1,249,745, approximately $243 per square foot. 1209 Raleigh Rd is a home located in Montgomery County with nearby schools including Harman Elementary School, Julian & Marjorie Lange School Elementary School, and Oakwood Junior High School.
Ownership History
Date
Name
Owned For
Owner Type
Purchase Details
Closed on
Mar 22, 2024
Sold by
Mcarthur John Rangel and Mcarthur Angela Dominique
Bought by
Whelan Chad T and Whelan Nicole S
Current Estimated Value
Home Financials for this Owner
Home Financials are based on the most recent Mortgage that was taken out on this home.
Original Mortgage
$1,196,000
Outstanding Balance
$1,172,797
Interest Rate
5.8%
Mortgage Type
New Conventional
Estimated Equity
$76,948
Purchase Details
Closed on
Mar 31, 2020
Sold by
Gray Virginia V
Bought by
Mcarthur John Rangel and Mcarthur Angela Dominique
Home Financials for this Owner
Home Financials are based on the most recent Mortgage that was taken out on this home.
Original Mortgage
$797,440
Interest Rate
3.25%
Mortgage Type
New Conventional
Purchase Details
Closed on
Jul 17, 2013
Sold by
Cammerer Molly A
Bought by
Wall Cammerer Mary Ann
Create a Home Valuation Report for This Property
The Home Valuation Report is an in-depth analysis detailing your home's value as well as a comparison with similar homes in the area
Home Values in the Area
Average Home Value in this Area
Purchase History
| Date | Buyer | Sale Price | Title Company |
|---|---|---|---|
| Whelan Chad T | $1,495,000 | None Listed On Document | |
| Mcarthur John Rangel | $890,000 | Triad Title Agency Inc | |
| Wall Cammerer Mary Ann | -- | None Available |
Source: Public Records
Mortgage History
| Date | Status | Borrower | Loan Amount |
|---|---|---|---|
| Open | Whelan Chad T | $1,196,000 | |
| Previous Owner | Mcarthur John Rangel | $797,440 |
Source: Public Records
Tax History Compared to Growth
Tax History
| Year | Tax Paid | Tax Assessment Tax Assessment Total Assessment is a certain percentage of the fair market value that is determined by local assessors to be the total taxable value of land and additions on the property. | Land | Improvement |
|---|---|---|---|---|
| 2024 | $22,133 | $297,200 | $76,770 | $220,430 |
| 2023 | $22,133 | $297,200 | $76,770 | $220,430 |
| 2022 | $20,716 | $232,190 | $59,980 | $172,210 |
| 2021 | $21,157 | $232,190 | $59,980 | $172,210 |
| 2020 | $19,857 | $232,190 | $59,980 | $172,210 |
| 2019 | $15,893 | $174,290 | $59,980 | $114,310 |
| 2018 | $14,622 | $174,290 | $59,980 | $114,310 |
| 2017 | $14,435 | $174,290 | $59,980 | $114,310 |
| 2016 | $20,781 | $225,730 | $59,980 | $165,750 |
| 2015 | $19,263 | $225,730 | $59,980 | $165,750 |
| 2014 | $19,263 | $225,730 | $59,980 | $165,750 |
| 2012 | -- | $237,040 | $55,080 | $181,960 |
Source: Public Records
Map
Nearby Homes
- 1211 Far Hills Ave Unit 215
- 1500 Ridgeway Rd
- 51 Forrer Rd
- 1305 E Schantz Ave
- 15 Lonsdale Ave
- 710 Harman Ave
- 1785 Far Hills Ave
- 1400 Runnymede Rd
- 674 Garden Rd
- 233 Wisteria Dr
- 1211 Runnymede Rd
- 116 Thruston Blvd W
- 226 Telford Ave
- 2020 Far Hills Ave
- 212 Wiltshire Blvd
- 2101 Far Hills Ave
- 332 Telford Ave
- 726 Acorn Dr
- 446 Lookout Ridge
- 334 Wiltshire Blvd
- 1301 Raleigh Rd
- 1208 Raleigh Rd
- 1216 Raleigh Rd
- 1100 Ridgeway Rd
- 1145 Harman Ave
- 1300 Raleigh Rd
- 1317 Raleigh Rd
- 1120 Harman Ave
- 1312 Devereux Dr
- 1130 Harman Ave
- 1177 Harman Ave
- 1316 Raleigh Rd
- 1140 Ridgeway Rd
- 1401 Raleigh Rd
- 1345 Devereux Dr
- 1324 Woodstock Dr
- 1320 Devereux Dr
- 1000 Harman Ave
- 1211 Far Hills Ave Unit 89
- 1211 Far Hills Ave Unit 401