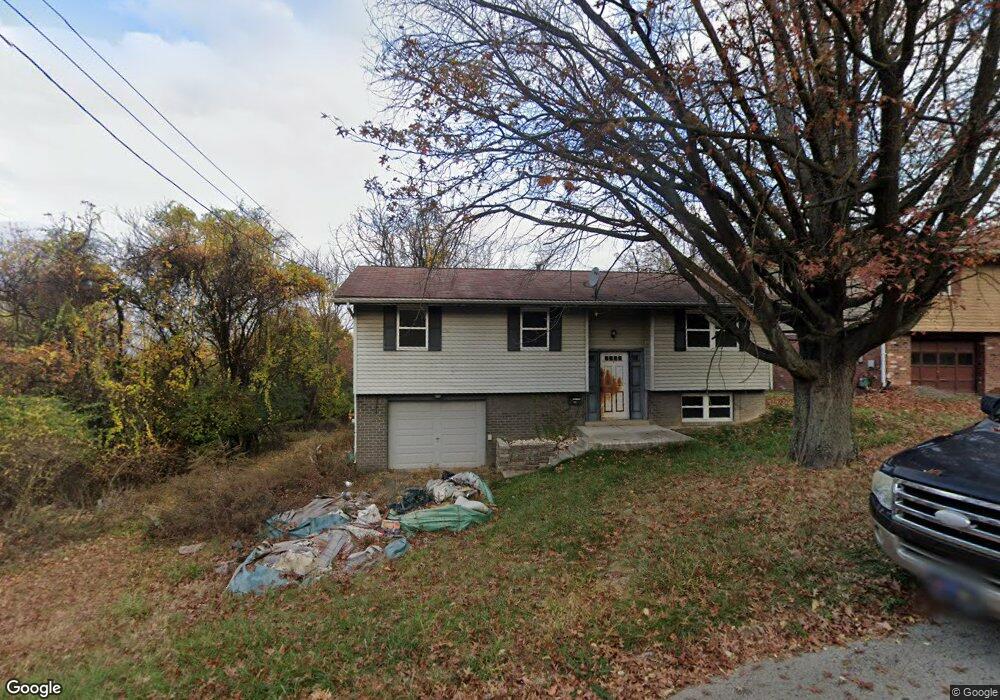
1209 Roy St Braddock, PA 15104
North Braddock NeighborhoodEstimated Value: $54,000 - $142,000
3
Beds
1
Bath
1,464
Sq Ft
$66/Sq Ft
Est. Value
About This Home
This home is located at 1209 Roy St, Braddock, PA 15104 and is currently estimated at $97,103, approximately $66 per square foot. 1209 Roy St is a home located in Allegheny County with nearby schools including Woodland Hills Senior High School, The Western Pennsylvania School for the Deaf, and Braddock Hills High School.
Ownership History
Date
Name
Owned For
Owner Type
Purchase Details
Closed on
Sep 3, 2019
Sold by
Estate Of Mary Ellen Hall
Bought by
Scott William F
Current Estimated Value
Purchase Details
Closed on
Dec 5, 1997
Sold by
Pocsatko Joseph and Pocsatko Mary N
Bought by
Beneficial Consumer Discount Company and Beneficial Mtg Co Of Pennsylvania
Purchase Details
Closed on
Aug 1, 1991
Bought by
Hall Mary Ellen
Create a Home Valuation Report for This Property
The Home Valuation Report is an in-depth analysis detailing your home's value as well as a comparison with similar homes in the area
Home Values in the Area
Average Home Value in this Area
Purchase History
| Date | Buyer | Sale Price | Title Company |
|---|---|---|---|
| Scott William F | -- | None Available | |
| Beneficial Consumer Discount Company | -- | -- | |
| Hall Mary Ellen | $51,500 | -- |
Source: Public Records
Tax History
| Year | Tax Paid | Tax Assessment Tax Assessment Total Assessment is a certain percentage of the fair market value that is determined by local assessors to be the total taxable value of land and additions on the property. | Land | Improvement |
|---|---|---|---|---|
| 2025 | $3,159 | $74,800 | $3,600 | $71,200 |
| 2024 | $3,159 | $74,800 | $3,600 | $71,200 |
| 2023 | $3,196 | $74,800 | $3,600 | $71,200 |
| 2022 | $3,196 | $74,800 | $3,600 | $71,200 |
| 2021 | $354 | $74,800 | $3,600 | $71,200 |
| 2020 | $3,130 | $74,800 | $3,600 | $71,200 |
| 2019 | $2,333 | $56,800 | $3,600 | $53,200 |
| 2018 | $269 | $56,800 | $3,600 | $53,200 |
| 2017 | $2,333 | $56,800 | $3,600 | $53,200 |
| 2016 | $269 | $56,800 | $3,600 | $53,200 |
| 2015 | $269 | $56,800 | $3,600 | $53,200 |
| 2014 | $2,166 | $56,800 | $3,600 | $53,200 |
Source: Public Records
Map
Nearby Homes
Your Personal Tour Guide
Ask me questions while you tour the home.