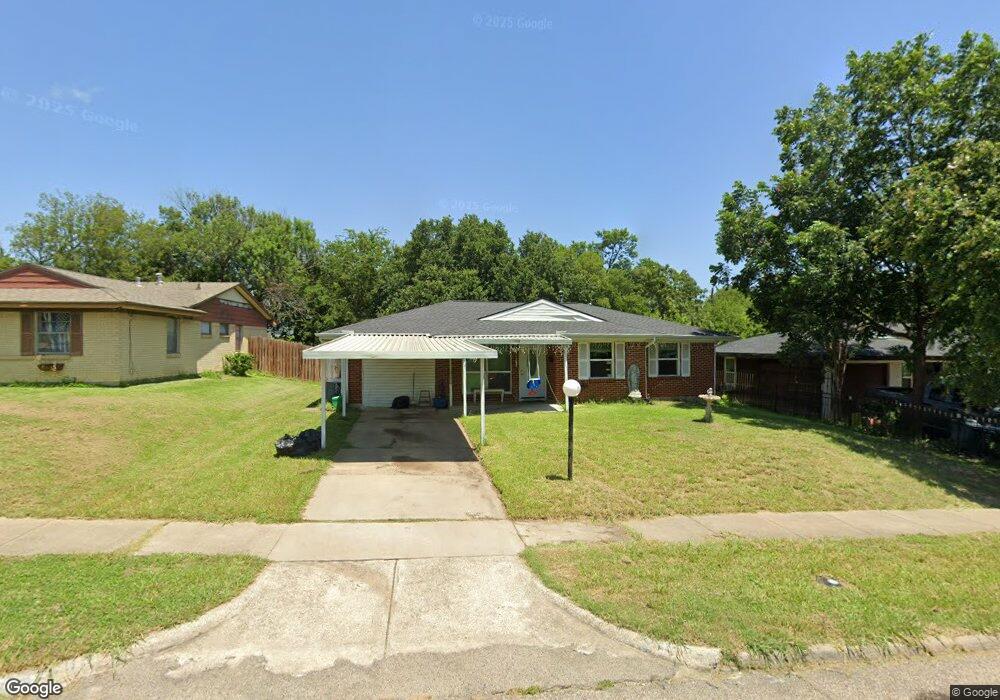
1209 Rusk Dr Mesquite, TX 75149
Estimated Value: $212,000 - $234,030
3
Beds
1
Bath
1,329
Sq Ft
$172/Sq Ft
Est. Value
About This Home
This home is located at 1209 Rusk Dr, Mesquite, TX 75149 and is currently estimated at $228,008, approximately $171 per square foot. 1209 Rusk Dr is a home located in Dallas County with nearby schools including Mcwhorter Elementary School, Lanny Frasier Middle, and West Mesquite High School.
Ownership History
Date
Name
Owned For
Owner Type
Purchase Details
Closed on
Apr 19, 2018
Sold by
Takeflyte Properties Llc
Bought by
Nunez Alfredo and Sierra Ines S
Current Estimated Value
Home Financials for this Owner
Home Financials are based on the most recent Mortgage that was taken out on this home.
Original Mortgage
$145,319
Outstanding Balance
$128,529
Interest Rate
5.75%
Mortgage Type
FHA
Estimated Equity
$99,479
Purchase Details
Closed on
Oct 19, 2017
Sold by
Shoreline Properties Group Llc
Bought by
Takeflyte Properties Llc
Purchase Details
Closed on
Oct 10, 2017
Sold by
Anders Linda Ann and Anders Albert Eral
Bought by
Andersa Linda Ann
Purchase Details
Closed on
Oct 19, 2016
Sold by
Anders Linda Ann
Bought by
Shoreline Properties Group Llc
Create a Home Valuation Report for This Property
The Home Valuation Report is an in-depth analysis detailing your home's value as well as a comparison with similar homes in the area
Purchase History
| Date | Buyer | Sale Price | Title Company |
|---|---|---|---|
| Nunez Alfredo | -- | Lawyers Title | |
| Takeflyte Properties Llc | -- | Tiago Title Llc | |
| Andersa Linda Ann | -- | None Available | |
| Shoreline Properties Group Llc | -- | Tiago Title Llc |
Source: Public Records
Mortgage History
| Date | Status | Borrower | Loan Amount |
|---|---|---|---|
| Open | Nunez Alfredo | $145,319 |
Source: Public Records
Tax History
| Year | Tax Paid | Tax Assessment Tax Assessment Total Assessment is a certain percentage of the fair market value that is determined by local assessors to be the total taxable value of land and additions on the property. | Land | Improvement |
|---|---|---|---|---|
| 2025 | $5,859 | $257,360 | $60,000 | $197,360 |
| 2024 | $5,859 | $257,360 | $60,000 | $197,360 |
| 2023 | $5,859 | $210,460 | $45,000 | $165,460 |
| 2022 | $5,288 | $210,460 | $45,000 | $165,460 |
| 2021 | $4,377 | $165,970 | $30,000 | $135,970 |
| 2020 | $4,089 | $146,300 | $30,000 | $116,300 |
| 2019 | $3,971 | $136,440 | $19,000 | $117,440 |
| 2018 | $3,563 | $127,090 | $19,000 | $108,090 |
| 2017 | $2,158 | $77,010 | $15,000 | $62,010 |
| 2016 | $1,537 | $54,850 | $15,000 | $39,850 |
| 2015 | $103 | $52,670 | $15,000 | $37,670 |
| 2014 | $103 | $47,310 | $15,000 | $32,310 |
Source: Public Records
Map
Nearby Homes
- 1221 Rusk Dr
- Lot 15 Central Park Ct
- Lot 14 Central Park Ct
- 1410 Athens Dr
- 1914 Del Oak Dr
- 2425 Avis St
- 2441 Lindale Ln
- 2429 Avis St
- 1530 Carson Dr
- 1418 Briarwood Dr
- 11915 Carson Dr
- 1309 Woodcrest Dr
- 1325 Woodcrest Dr
- 1901 Pyramid Dr
- 11805 Eloise Dr
- 2633 Dean St
- 2629 Dean St
- 2637 Dean St
- 1757 Patrick Cir
- 1726 Hillcrest Ct
Your Personal Tour Guide
Ask me questions while you tour the home.