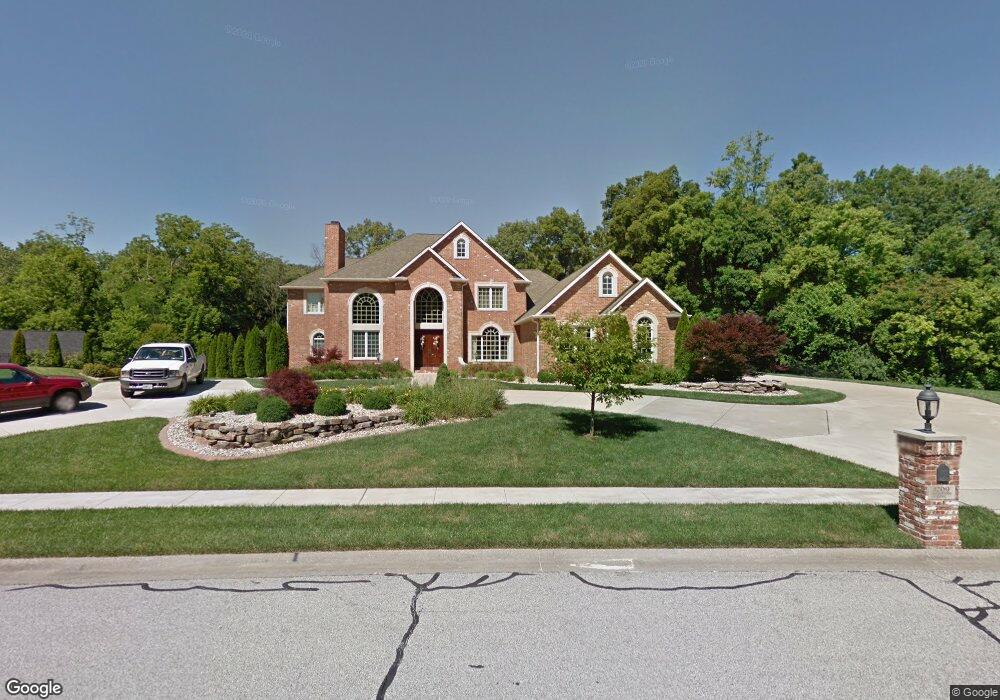
1209 Rutherford Ridge O Fallon, IL 62269
Estimated Value: $639,000 - $1,185,000
--
Bed
--
Bath
2,096
Sq Ft
$432/Sq Ft
Est. Value
About This Home
This home is located at 1209 Rutherford Ridge, O Fallon, IL 62269 and is currently estimated at $904,459, approximately $431 per square foot. 1209 Rutherford Ridge is a home located in St. Clair County with nearby schools including Moye Elementary School, Carriel Junior High School, and O'Fallon Township High School.
Ownership History
Date
Name
Owned For
Owner Type
Purchase Details
Closed on
Feb 9, 2023
Sold by
Glover Carmon Len and Glover Jamie K
Bought by
Glover Carmon Lenzie and Carmon Lezie Glover Iii Trust
Current Estimated Value
Purchase Details
Closed on
Aug 21, 2006
Sold by
Royer Preston and Royer Stacie
Bought by
Glover Carmon Len and Glover Jamie K
Home Financials for this Owner
Home Financials are based on the most recent Mortgage that was taken out on this home.
Original Mortgage
$160,000
Interest Rate
7%
Mortgage Type
Purchase Money Mortgage
Purchase Details
Closed on
Dec 21, 2005
Sold by
Lubenow Bradley M and Lubenow Angie
Bought by
Royer Preston and Royer Stacie
Purchase Details
Closed on
Jan 6, 2005
Sold by
Dellapietra Angelo A and Dellapietra Donna B
Bought by
Lubenow Bradley M and Lubenow Angie
Home Financials for this Owner
Home Financials are based on the most recent Mortgage that was taken out on this home.
Original Mortgage
$120,000
Interest Rate
6%
Mortgage Type
Purchase Money Mortgage
Create a Home Valuation Report for This Property
The Home Valuation Report is an in-depth analysis detailing your home's value as well as a comparison with similar homes in the area
Home Values in the Area
Average Home Value in this Area
Purchase History
| Date | Buyer | Sale Price | Title Company |
|---|---|---|---|
| Glover Carmon Lenzie | -- | None Available | |
| Glover Carmon Len | $200,000 | Landstar Title Company | |
| Royer Preston | $185,000 | Landstar Title Company | |
| Lubenow Bradley M | $160,000 | Chicago Title |
Source: Public Records
Mortgage History
| Date | Status | Borrower | Loan Amount |
|---|---|---|---|
| Previous Owner | Glover Carmon Len | $160,000 | |
| Previous Owner | Lubenow Bradley M | $120,000 |
Source: Public Records
Tax History Compared to Growth
Tax History
| Year | Tax Paid | Tax Assessment Tax Assessment Total Assessment is a certain percentage of the fair market value that is determined by local assessors to be the total taxable value of land and additions on the property. | Land | Improvement |
|---|---|---|---|---|
| 2024 | $24,339 | $333,892 | $47,716 | $286,176 |
| 2023 | $22,453 | $296,345 | $42,350 | $253,995 |
| 2022 | $21,234 | $272,451 | $38,935 | $233,516 |
| 2021 | $18,149 | $228,600 | $35,509 | $193,091 |
| 2020 | $18,026 | $216,389 | $33,612 | $182,777 |
| 2019 | $17,638 | $216,389 | $33,612 | $182,777 |
| 2018 | $17,186 | $210,107 | $32,636 | $177,471 |
| 2017 | $0 | $203,467 | $34,028 | $169,439 |
| 2016 | $17,213 | $198,718 | $33,234 | $165,484 |
| 2014 | $15,943 | $196,420 | $32,850 | $163,570 |
| 2013 | $15,292 | $192,865 | $32,346 | $160,519 |
Source: Public Records
Map
Nearby Homes
- 1676 Lancaster Dr
- 1830 Riviera Ln
- 1845 Riviera Ln
- 109 Callaway Ct
- 1588 Turn Creek Ct
- 157 Knob Creek Ln
- 213 Hodgens Mill Ln
- 108 Chickasaw Ln
- 710 Victoria Ln
- 1551 N Parc Grove Ct
- 1509 Cedar Ridge Dr
- 500 Lake Vista Way
- 1183 Tazewell Dr
- 7650 Jeffrey Ct
- 809 E Deer Creek Rd
- 1342 Stone Creek Dr
- 1356 Dove Hollow Cir
- 323 Moultrie Ln
- 1217 Dempcy Ln
- 14 Shallowbrook Dr
- 1205 Rutherford Ridge
- 1214 Rutherford Ridge
- 1206 Rutherford Ridge
- 1217 Rutherford Ridge
- 1154 Windermere Run
- 1201 Rutherford Ridge
- 152 Stonehaven Ct
- 1162 Windermere Run
- 1222 Rutherford Ridge
- 1150 Windermere Run
- 156 Stonehaven Ct
- 1221 Rutherford Ridge
- 1159 Windermere Run
- 1155 Windermere Run
- 1230 Rutherford Ridge
- 1151 Rutherford Ridge
- 1166 Windermere Run
- 1152 Rutherford Ridge
- 1254 Rutherford Ridge
- 1151 Windermere Run