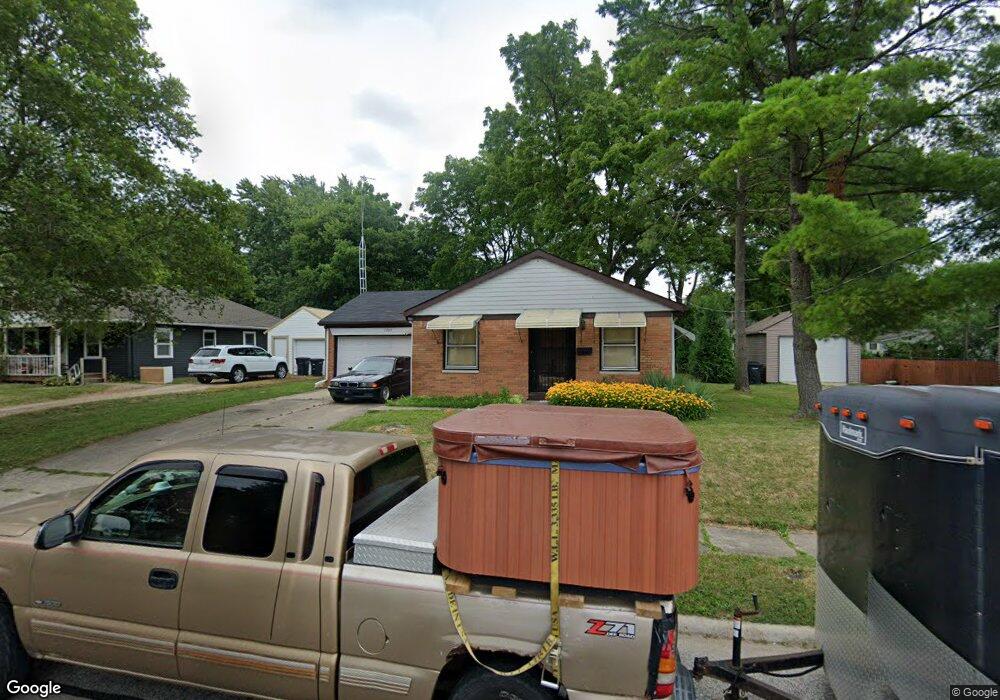
1209 S 21st St Lafayette, IN 47905
South Oakland NeighborhoodEstimated Value: $168,000 - $205,171
--
Bed
1
Bath
960
Sq Ft
$195/Sq Ft
Est. Value
About This Home
This home is located at 1209 S 21st St, Lafayette, IN 47905 and is currently estimated at $187,043, approximately $194 per square foot. 1209 S 21st St is a home located in Tippecanoe County with nearby schools including Oakland Elementary School, Lafayette Tecumseh Junior High School, and Sunnyside Intermediate School.
Ownership History
Date
Name
Owned For
Owner Type
Purchase Details
Closed on
Jul 28, 2005
Sold by
Werner Thomas D
Bought by
Reiss James M
Current Estimated Value
Home Financials for this Owner
Home Financials are based on the most recent Mortgage that was taken out on this home.
Original Mortgage
$56,300
Outstanding Balance
$29,670
Interest Rate
5.71%
Mortgage Type
Purchase Money Mortgage
Estimated Equity
$157,373
Create a Home Valuation Report for This Property
The Home Valuation Report is an in-depth analysis detailing your home's value as well as a comparison with similar homes in the area
Home Values in the Area
Average Home Value in this Area
Purchase History
| Date | Buyer | Sale Price | Title Company |
|---|---|---|---|
| Reiss James M | -- | -- |
Source: Public Records
Mortgage History
| Date | Status | Borrower | Loan Amount |
|---|---|---|---|
| Open | Reiss James M | $56,300 |
Source: Public Records
Tax History Compared to Growth
Tax History
| Year | Tax Paid | Tax Assessment Tax Assessment Total Assessment is a certain percentage of the fair market value that is determined by local assessors to be the total taxable value of land and additions on the property. | Land | Improvement |
|---|---|---|---|---|
| 2024 | $1,039 | $128,600 | $18,000 | $110,600 |
| 2023 | $921 | $118,600 | $18,000 | $100,600 |
| 2022 | $779 | $100,400 | $18,000 | $82,400 |
| 2021 | $610 | $88,000 | $18,000 | $70,000 |
| 2020 | $431 | $77,300 | $18,000 | $59,300 |
| 2019 | $412 | $76,300 | $19,800 | $56,500 |
| 2018 | $404 | $74,000 | $19,800 | $54,200 |
| 2017 | $384 | $71,400 | $19,800 | $51,600 |
| 2016 | $305 | $64,000 | $19,800 | $44,200 |
| 2014 | $313 | $66,500 | $19,800 | $46,700 |
| 2013 | $306 | $66,000 | $19,800 | $46,200 |
Source: Public Records
Map
Nearby Homes
- 2109 Central St
- 1309 S 23rd St
- 807 S 20th St
- 815 S 19th St
- 1639 Stanforth Ave
- 626 S 21st St
- 622 S 21st St
- 2614 Main St
- 1501 Franklin St
- 1501 El Prado Ave
- 1226 Sinton Ave
- 1318 Sinton Ave
- 1111 S 14th St
- 711 S 27th St
- 1511 Kossuth St
- 1422 Virginia St
- 1920 Perdue St
- 1214 King St
- 1204 Central St
- 1406 Virginia St