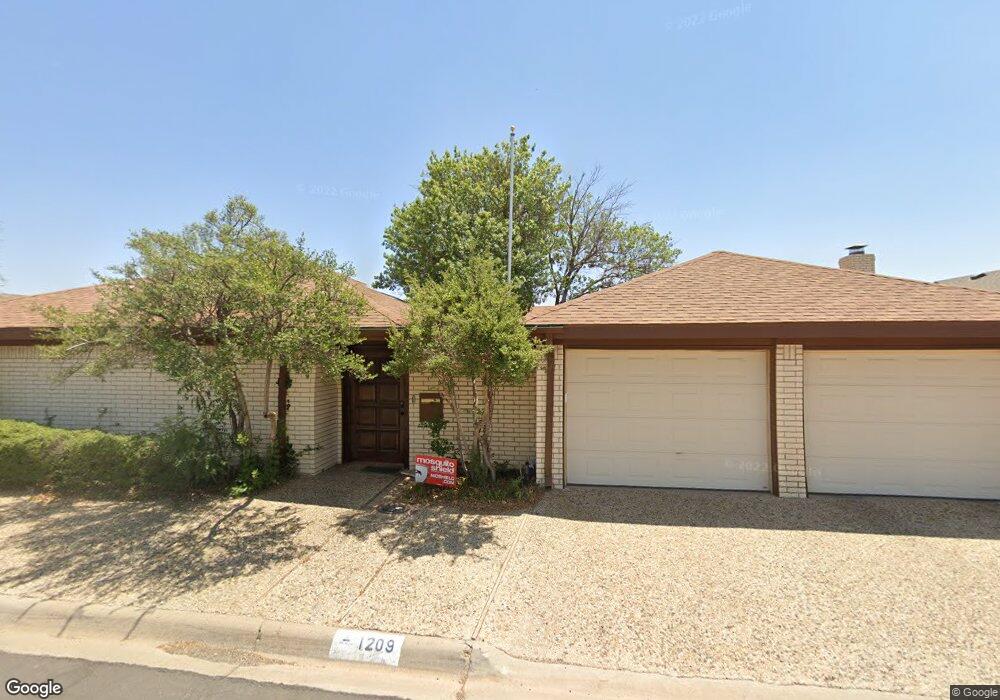
1209 Shirley Ln Midland, TX 79705
Estimated Value: $420,000 - $445,000
3
Beds
3
Baths
2,698
Sq Ft
$161/Sq Ft
Est. Value
About This Home
This home is located at 1209 Shirley Ln, Midland, TX 79705 and is currently estimated at $434,506, approximately $161 per square foot. 1209 Shirley Ln is a home located in Midland County with nearby schools including Fannin Elementary School, Midland High School, and The Hillander School.
Ownership History
Date
Name
Owned For
Owner Type
Purchase Details
Closed on
Aug 14, 2024
Sold by
Whitt Robert K
Bought by
Pace Robert Marcus
Current Estimated Value
Purchase Details
Closed on
Jun 28, 2024
Sold by
Hughes Charles Norfleet
Bought by
Whitt Robert K
Purchase Details
Closed on
May 3, 2018
Sold by
Moreland Roland T
Bought by
Hughes Charles Norfleet
Purchase Details
Closed on
May 1, 2018
Sold by
Moreland Roger C and Van Roshelle
Bought by
Moreland Roland T
Purchase Details
Closed on
Apr 30, 2018
Sold by
Moreland Roger C and Moreland Roland T
Bought by
Moreland Roger C and Moreland Roland T
Purchase Details
Closed on
Apr 12, 2006
Sold by
Armstrong John F and Armstrong Mary E
Bought by
Moreland Betty
Purchase Details
Closed on
May 19, 1981
Bought by
Moreland Betty Est
Create a Home Valuation Report for This Property
The Home Valuation Report is an in-depth analysis detailing your home's value as well as a comparison with similar homes in the area
Home Values in the Area
Average Home Value in this Area
Purchase History
| Date | Buyer | Sale Price | Title Company |
|---|---|---|---|
| Pace Robert Marcus | -- | Permian Abstract | |
| Whitt Robert K | -- | Permian Abstract | |
| Hughes Charles Norfleet | -- | None Available | |
| Moreland Roland T | -- | None Available | |
| Moreland Roger C | -- | None Available | |
| Moreland Betty | -- | Lone Star Abstract & Title C | |
| Moreland Betty Est | -- | -- |
Source: Public Records
Tax History Compared to Growth
Tax History
| Year | Tax Paid | Tax Assessment Tax Assessment Total Assessment is a certain percentage of the fair market value that is determined by local assessors to be the total taxable value of land and additions on the property. | Land | Improvement |
|---|---|---|---|---|
| 2025 | $4,077 | $401,740 | $16,430 | $385,310 |
| 2024 | $4,084 | $347,660 | $16,430 | $331,230 |
| 2023 | $3,646 | $321,360 | $16,430 | $304,930 |
| 2022 | $4,861 | $311,150 | $16,430 | $294,720 |
| 2021 | $5,380 | $308,810 | $16,430 | $292,380 |
| 2020 | $4,744 | $312,590 | $16,430 | $296,160 |
| 2019 | $5,918 | $312,590 | $16,430 | $296,160 |
| 2018 | $5,394 | $277,430 | $16,430 | $261,000 |
| 2017 | $5,081 | $261,310 | $16,430 | $244,880 |
| 2016 | $4,829 | $255,910 | $16,430 | $239,480 |
| 2015 | -- | $255,910 | $16,430 | $239,480 |
| 2014 | -- | $254,940 | $0 | $0 |
Source: Public Records
Map
Nearby Homes
- 1209 W Pecan Ave
- 2202 Western Dr
- 907 Shirley Ct
- 2105 Oaklawn Dr
- 2109 Western Dr
- 806 Stanolind Ave
- 1611 W Pecan Ave
- 2704 N L St
- 1200 W Scharbauer Dr
- 1202 W Scharbauer Dr
- 1210 W Scharbauer Dr
- 1602 Winfield Rd
- 1805 N D St
- 2016 Gulf Prairie Ln
- 1000 Sinclair Ave
- 2000 Neely Ave
- 716 Melton Alley
- 809 Sinclair Ave
- 1606 Shell Ave
- TBD Bonham St
- 1207 Shirley Ln
- 1211 Shirley Ln
- 1208 Neely Ave
- 1206 Neely Ave
- 1210 Neely Ave
- 1208 Shirley Ln
- 1210 Shirley Ln
- 1205 Shirley Ln
- 1204 Neely Ave
- 1206 Shirley Ln
- 1204 Shirley Ln
- 1203 Shirley Ln
- 1202 Neely Ave
- 1207 W Pecan Ave
- 1 Oaklawn Park
- 1205 W Pecan Ave
- 1202 Shirley Ln
- 12 Oaklawn Park
- 1201 Shirley Ln
- 1200 Neely Ave