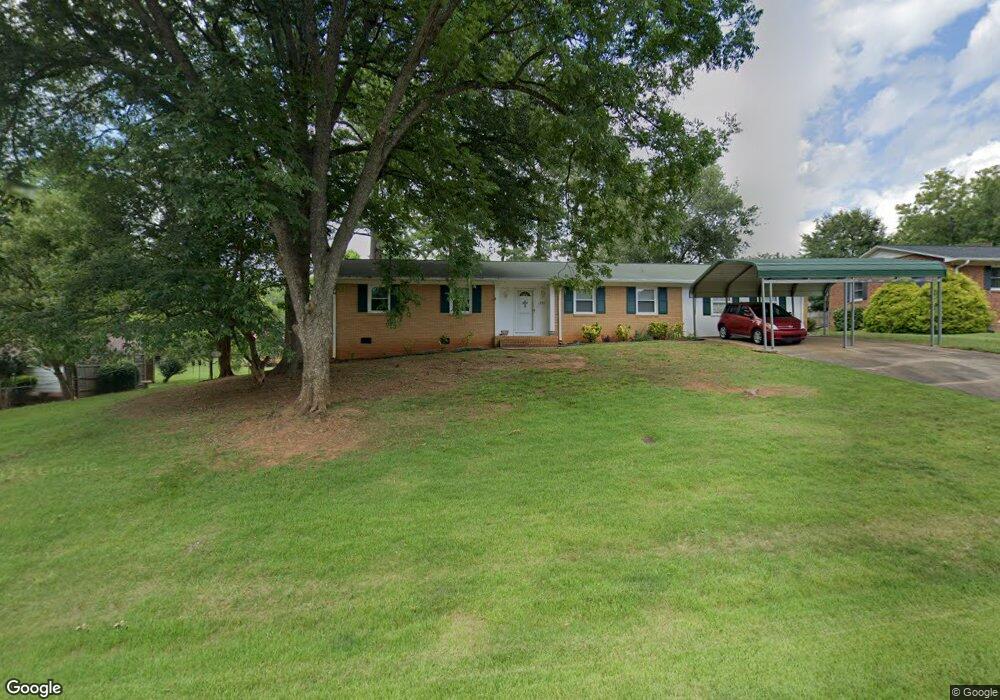
1209 Spring Dr Shelby, NC 28150
Estimated Value: $254,787 - $313,000
3
Beds
2
Baths
1,810
Sq Ft
$157/Sq Ft
Est. Value
About This Home
This home is located at 1209 Spring Dr, Shelby, NC 28150 and is currently estimated at $284,197, approximately $157 per square foot. 1209 Spring Dr is a home located in Cleveland County with nearby schools including Jefferson Elementary School, Shelby Middle School, and Shelby High School.
Ownership History
Date
Name
Owned For
Owner Type
Purchase Details
Closed on
Mar 4, 2025
Sold by
Stephens Robert Eugene and Baxla Emily Gillette
Bought by
Baxla Emily Gillette
Current Estimated Value
Purchase Details
Closed on
Jun 5, 2014
Sold by
The Secretary Of Veterans Affairs
Bought by
Stephens Robert Eugene and Baxla Emily Gillette
Purchase Details
Closed on
Aug 12, 2013
Sold by
Watson Lawrence H and Watson Tammie S
Bought by
Secretary Of Veterans Affairs
Purchase Details
Closed on
Mar 10, 2010
Sold by
Canipe Chris Sean and Canipe Elizabeth A
Bought by
Watson Lawrence H and Watson Tammie S
Home Financials for this Owner
Home Financials are based on the most recent Mortgage that was taken out on this home.
Original Mortgage
$116,451
Interest Rate
4.97%
Mortgage Type
VA
Create a Home Valuation Report for This Property
The Home Valuation Report is an in-depth analysis detailing your home's value as well as a comparison with similar homes in the area
Home Values in the Area
Average Home Value in this Area
Purchase History
| Date | Buyer | Sale Price | Title Company |
|---|---|---|---|
| Baxla Emily Gillette | -- | None Listed On Document | |
| Stephens Robert Eugene | $57,000 | None Available | |
| Secretary Of Veterans Affairs | $96,943 | None Available | |
| Watson Lawrence H | $119,500 | None Available |
Source: Public Records
Mortgage History
| Date | Status | Borrower | Loan Amount |
|---|---|---|---|
| Previous Owner | Watson Lawrence H | $116,451 |
Source: Public Records
Tax History
| Year | Tax Paid | Tax Assessment Tax Assessment Total Assessment is a certain percentage of the fair market value that is determined by local assessors to be the total taxable value of land and additions on the property. | Land | Improvement |
|---|---|---|---|---|
| 2025 | $2,024 | $203,462 | $16,480 | $186,982 |
| 2024 | $1,342 | $109,268 | $14,935 | $94,333 |
| 2023 | $1,335 | $109,268 | $14,935 | $94,333 |
| 2022 | $1,335 | $109,268 | $14,935 | $94,333 |
| 2021 | $1,342 | $109,268 | $14,935 | $94,333 |
| 2020 | $1,043 | $82,189 | $14,935 | $67,254 |
| 2019 | $1,043 | $82,189 | $14,935 | $67,254 |
| 2018 | $1,042 | $82,189 | $14,935 | $67,254 |
| 2017 | $1,016 | $82,189 | $14,935 | $67,254 |
| 2016 | $1,019 | $82,189 | $14,935 | $67,254 |
| 2015 | -- | $93,096 | $14,935 | $78,161 |
| 2014 | -- | $93,096 | $14,935 | $78,161 |
Source: Public Records
Map
Nearby Homes
- 1210 Brookwood Dr
- 0 Crestview Dr Unit CAR4357915
- 316 Sunrise Cir
- 205 Vauxhall Dr
- 318 Sunrise Cir
- 510 Cherryville Rd
- 114 Sunrise Cir
- 115 Sunrise Cir
- 174 Columns Cir
- 150 Columns Cir
- 204 Country Club Cir
- 438 Country Club Acres
- 102 Park St
- 320 Country Club Acres None
- 316 Country Club Acres None
- 435 Country Club Ct
- 1029 Hunter Valley Rd
- 216 Country Club Rd
- 522 Country Club Cir
- 1467 E Marion St
- 1207 Spring Dr
- 1211 Spring Dr
- 1208 Meadowood Ln
- 1206 Meadowood Ln
- 1210 Meadowood Ln
- 1205 Spring Dr
- 1213 Spring Dr
- 1208 Spring Dr
- 1204 Meadowood Ln
- 1212 Meadowood Ln
- 1204 Spring Dr
- 1210 Spring Dr
- 1215 Spring Dr
- 1203 Spring Dr
- 1202 Meadowood Ln
- 1214 Meadowood Ln
- 1214 Meadowood Dr
- 1202 Spring Dr
- 1212 Spring Dr
- 1207 Brookwood Rd
Your Personal Tour Guide
Ask me questions while you tour the home.