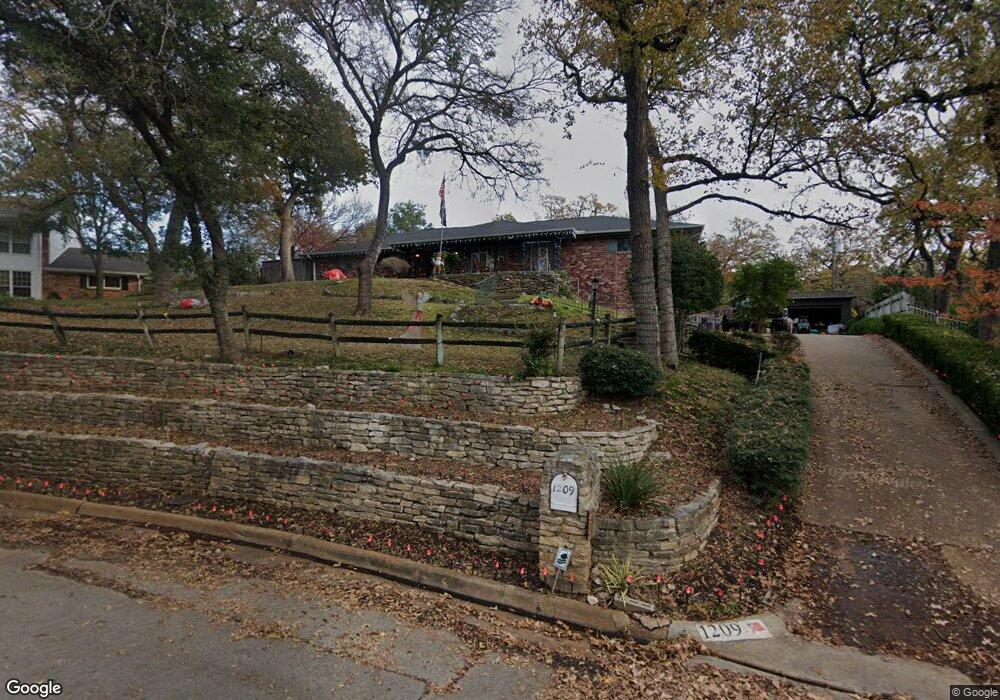
1209 Springwood Ct Euless, TX 76040
Estimated Value: $451,000 - $570,000
4
Beds
3
Baths
2,710
Sq Ft
$182/Sq Ft
Est. Value
About This Home
This home is located at 1209 Springwood Ct, Euless, TX 76040 and is currently estimated at $494,348, approximately $182 per square foot. 1209 Springwood Ct is a home located in Tarrant County with nearby schools including Stonegate Elementary School, Central J High School, and L.D. Bell High School.
Ownership History
Date
Name
Owned For
Owner Type
Purchase Details
Closed on
May 17, 2018
Sold by
Jacoby Frances R
Bought by
Shoemake Jack Daniel and Shoemake Jennifer
Current Estimated Value
Home Financials for this Owner
Home Financials are based on the most recent Mortgage that was taken out on this home.
Original Mortgage
$240,000
Outstanding Balance
$206,648
Interest Rate
4.4%
Mortgage Type
New Conventional
Estimated Equity
$287,700
Purchase Details
Closed on
Dec 31, 2017
Sold by
Jacoby Frances Renee
Bought by
Jacoby Frances Renee
Purchase Details
Closed on
Dec 29, 2017
Sold by
Jacoby Frances Renee
Bought by
Midgley Community Property Trust
Purchase Details
Closed on
Jan 2, 2016
Sold by
Jacoby Frances Renee
Bought by
Jacoby Frances Renee and Midgley Family Trust
Purchase Details
Closed on
Jan 1, 2016
Sold by
Jacoby Frances Renee
Bought by
Jacoby Frances Renee and Midgley Base Trust
Create a Home Valuation Report for This Property
The Home Valuation Report is an in-depth analysis detailing your home's value as well as a comparison with similar homes in the area
Home Values in the Area
Average Home Value in this Area
Purchase History
| Date | Buyer | Sale Price | Title Company |
|---|---|---|---|
| Shoemake Jack Daniel | -- | None Available | |
| Jacoby Frances Renee | -- | None Available | |
| Midgley Community Property Trust | -- | None Available | |
| Jacoby Frances Renee | -- | Attorney | |
| Jacoby Frances Renee | -- | None Available |
Source: Public Records
Mortgage History
| Date | Status | Borrower | Loan Amount |
|---|---|---|---|
| Open | Shoemake Jack Daniel | $240,000 |
Source: Public Records
Tax History
| Year | Tax Paid | Tax Assessment Tax Assessment Total Assessment is a certain percentage of the fair market value that is determined by local assessors to be the total taxable value of land and additions on the property. | Land | Improvement |
|---|---|---|---|---|
| 2025 | $6,186 | $352,090 | $90,000 | $262,090 |
| 2024 | $6,186 | $424,000 | $90,000 | $334,000 |
| 2023 | $5,637 | $420,591 | $70,000 | $350,591 |
| 2022 | $7,380 | $354,094 | $70,000 | $284,094 |
| 2021 | $7,023 | $318,782 | $70,000 | $248,782 |
| 2020 | $6,447 | $283,887 | $70,000 | $213,887 |
| 2019 | $6,712 | $288,049 | $70,000 | $218,049 |
| 2018 | $7,066 | $303,262 | $40,000 | $263,262 |
| 2017 | $5,847 | $283,542 | $40,000 | $243,542 |
| 2016 | $5,315 | $238,182 | $40,000 | $198,182 |
| 2015 | $2,463 | $200,900 | $25,500 | $175,400 |
| 2014 | $2,463 | $204,200 | $25,500 | $178,700 |
Source: Public Records
Map
Nearby Homes
- 816 Chaparral Ct
- 1309 Driftwood Dr
- 1306 Driftwood Dr
- 832 Chateau Valee Cir
- 1302 Woodridge Cir
- 904 Nelson Terrace
- 4106 Hollow Oak Dr
- 909 Overhill Dr
- 904 Dee Ln
- 808 Lee Dr
- 740 Shady Ln
- 933 Wade Dr
- 860 Lee Dr
- 1405 Bryan Dr
- 705 Timbercreek Dr
- 1621 Lexington Place
- 1613 Trinity Ct
- 1117 Wade Dr
- 840 Forest Hollow Dr
- 1205 Circle Ln
- 3904 Woodvine Dr
- 1207 Springwood Ct
- 1211 Springwood Ct
- 1208 Cliffwood Rd
- 3902 Woodvine Dr
- 1206 Springwood Ct
- 3906 Woodvine Dr
- 1206 Cliffwood Rd
- 1205 Springwood Ct
- 1209 Shady Creek Dr
- 1204 Springwood Ct
- 1207 Shady Creek Dr
- 1301 Shady Creek Dr
- 3908 Woodvine Dr
- 3903 Woodvine Dr
- 1204 Cliffwood Rd
- 3905 Woodvine Dr
- 1211 Cliffwood Rd
- 1303 Shady Creek Dr
- 1205 Shady Creek Dr
Your Personal Tour Guide
Ask me questions while you tour the home.