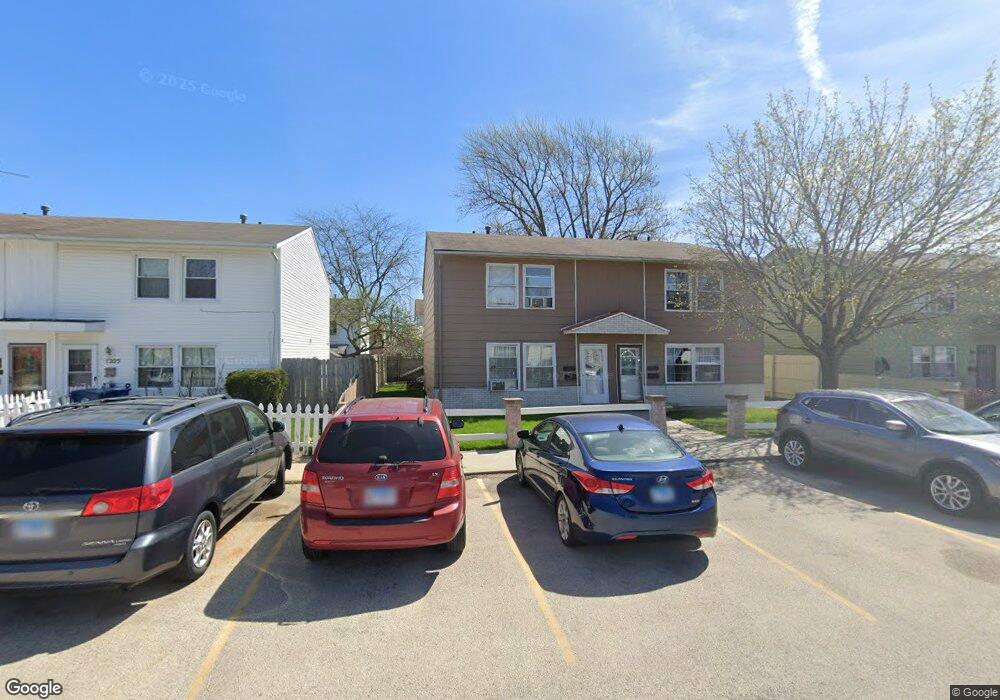
1209 Tobin Ct Waukegan, IL 60085
Lewis Glenn NeighborhoodEstimated Value: $177,000 - $222,635
4
Beds
2
Baths
1,280
Sq Ft
$150/Sq Ft
Est. Value
About This Home
This home is located at 1209 Tobin Ct, Waukegan, IL 60085 and is currently estimated at $191,909, approximately $149 per square foot. 1209 Tobin Ct is a home located in Lake County with nearby schools including Clearview Elementary School, John R Lewis Middle School, and Waukegan High School.
Ownership History
Date
Name
Owned For
Owner Type
Purchase Details
Closed on
Feb 4, 2006
Sold by
Patlan Enrique and Patlan Jose
Bought by
Patlan Enrique and Gallegos Raquel
Current Estimated Value
Purchase Details
Closed on
Dec 13, 2003
Sold by
Patlan Enrique and Patlan Jose
Bought by
Gallegos Raquel and Patlan Enrique
Purchase Details
Closed on
Nov 26, 1996
Sold by
Miller Marian E
Bought by
Patlan Enrique and Patlan Jose
Home Financials for this Owner
Home Financials are based on the most recent Mortgage that was taken out on this home.
Original Mortgage
$49,600
Outstanding Balance
$5,138
Interest Rate
7.91%
Estimated Equity
$186,771
Create a Home Valuation Report for This Property
The Home Valuation Report is an in-depth analysis detailing your home's value as well as a comparison with similar homes in the area
Home Values in the Area
Average Home Value in this Area
Purchase History
| Date | Buyer | Sale Price | Title Company |
|---|---|---|---|
| Patlan Enrique | -- | None Available | |
| Gallegos Raquel | -- | -- | |
| Patlan Enrique | $62,000 | Ticor Title Insurance Compan |
Source: Public Records
Mortgage History
| Date | Status | Borrower | Loan Amount |
|---|---|---|---|
| Open | Patlan Enrique | $49,600 | |
| Closed | Patlan Enrique | $8,200 |
Source: Public Records
Tax History Compared to Growth
Tax History
| Year | Tax Paid | Tax Assessment Tax Assessment Total Assessment is a certain percentage of the fair market value that is determined by local assessors to be the total taxable value of land and additions on the property. | Land | Improvement |
|---|---|---|---|---|
| 2024 | $3,305 | $41,714 | $5,978 | $35,736 |
| 2023 | $2,720 | $35,723 | $5,119 | $30,604 |
| 2022 | $2,720 | $28,201 | $3,343 | $24,858 |
| 2021 | $2,571 | $25,073 | $2,955 | $22,118 |
| 2020 | $2,605 | $23,359 | $2,753 | $20,606 |
| 2019 | $2,622 | $21,405 | $2,523 | $18,882 |
| 2018 | $2,034 | $21,972 | $2,855 | $19,117 |
| 2017 | $1,184 | $19,439 | $2,526 | $16,913 |
| 2016 | $899 | $16,892 | $2,195 | $14,697 |
| 2015 | $679 | $15,119 | $1,965 | $13,154 |
| 2014 | $838 | $16,059 | $2,013 | $14,046 |
| 2012 | $1,764 | $17,398 | $2,181 | $15,217 |
Source: Public Records
Map
Nearby Homes
- 1712 11th St
- 1511 14th St
- 1521 Seymour Ave
- 1244 Victoria Ave
- 819 S Fulton Ave
- 1617 Grove Ave
- 1535 Glenn Dr
- 1423 Victoria Ave
- 1210 Park Ave
- 1542 Victoria Ave
- 720 13th St
- 1301 Park Ave
- 1641 Jackson St
- 724 10th St
- 1815 Hervey Ave
- 1101 Adams St
- 1102 Wadsworth Ave
- 1702 Lincoln St
- 815 Prescott St
- 842 Wadsworth Ave
- 1205 Tobin Ct
- 1211 Tobin Ct
- 1217 Tobin Ct
- 1203 Tobin Ct
- 1223 Tobin Ct
- 1210 S Fulton Ave
- 1206 S Fulton Ave
- 1214 S Fulton Ave
- 1227 Tobin Ct
- 1218 S Fulton Ave
- 1202 S Fulton Ave
- 1210 Tobin Ct
- 1212 Tobin Ct
- 1222 S Fulton Ave
- 1218 Tobin Ct
- 1231 Tobin Ct
- 1155 Tobin Ct
- 1220 Tobin Ct
- 1226 S Fulton Ave
- 1652 12th St