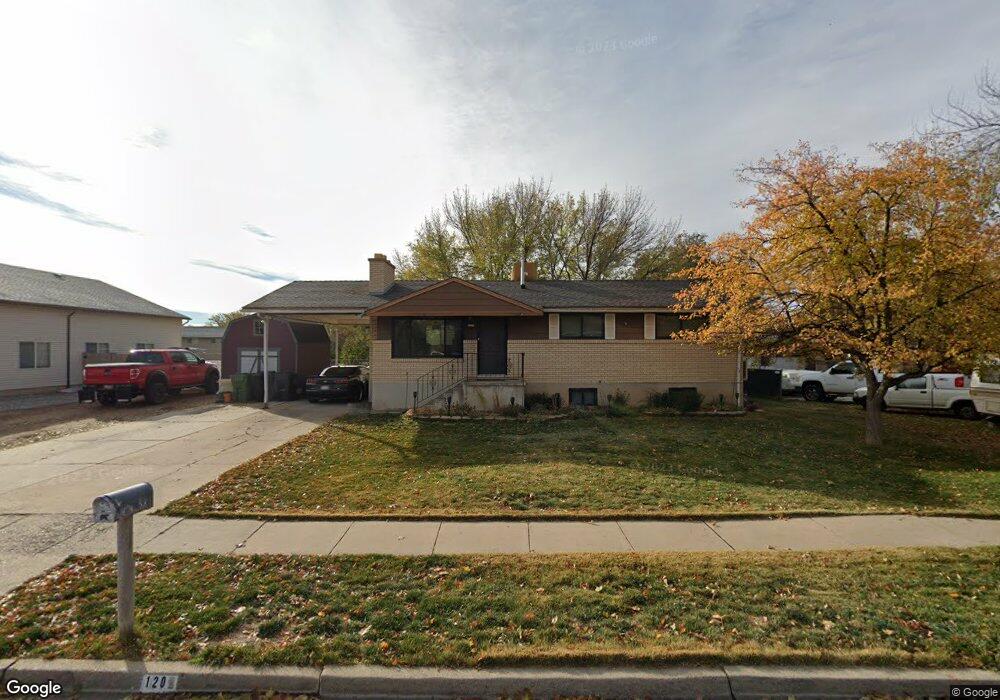
1209 W 1290 S Syracuse, UT 84075
Estimated Value: $420,000 - $439,788
5
Beds
2
Baths
1,025
Sq Ft
$419/Sq Ft
Est. Value
About This Home
This home is located at 1209 W 1290 S, Syracuse, UT 84075 and is currently estimated at $429,197, approximately $418 per square foot. 1209 W 1290 S is a home located in Davis County with nearby schools including Cook School, Syracuse Junior High School, and Syracuse High School.
Ownership History
Date
Name
Owned For
Owner Type
Purchase Details
Closed on
Nov 5, 1998
Sold by
Blanscett Todd B and Blanscett Laurie E
Bought by
Johnson Jeff and Johnson Jill
Current Estimated Value
Home Financials for this Owner
Home Financials are based on the most recent Mortgage that was taken out on this home.
Original Mortgage
$114,300
Outstanding Balance
$30,390
Interest Rate
9.35%
Estimated Equity
$398,807
Create a Home Valuation Report for This Property
The Home Valuation Report is an in-depth analysis detailing your home's value as well as a comparison with similar homes in the area
Home Values in the Area
Average Home Value in this Area
Purchase History
| Date | Buyer | Sale Price | Title Company |
|---|---|---|---|
| Johnson Jeff | -- | Legacy Land Title Co |
Source: Public Records
Mortgage History
| Date | Status | Borrower | Loan Amount |
|---|---|---|---|
| Open | Johnson Jeff | $114,300 |
Source: Public Records
Tax History Compared to Growth
Tax History
| Year | Tax Paid | Tax Assessment Tax Assessment Total Assessment is a certain percentage of the fair market value that is determined by local assessors to be the total taxable value of land and additions on the property. | Land | Improvement |
|---|---|---|---|---|
| 2025 | $2,143 | $206,800 | $128,486 | $78,314 |
| 2024 | $2,112 | $205,150 | $109,715 | $95,435 |
| 2023 | $1,983 | $351,000 | $152,674 | $198,326 |
| 2022 | $2,103 | $204,050 | $87,406 | $116,644 |
| 2021 | $1,977 | $297,000 | $129,562 | $167,438 |
| 2020 | $1,733 | $252,000 | $111,124 | $140,876 |
| 2019 | $1,581 | $227,000 | $110,748 | $116,252 |
| 2018 | $1,397 | $199,000 | $105,810 | $93,190 |
| 2016 | $1,181 | $88,275 | $40,534 | $47,741 |
| 2015 | $1,125 | $80,080 | $40,534 | $39,546 |
| 2014 | $1,135 | $82,353 | $40,534 | $41,819 |
| 2013 | -- | $72,743 | $29,885 | $42,858 |
Source: Public Records
Map
Nearby Homes