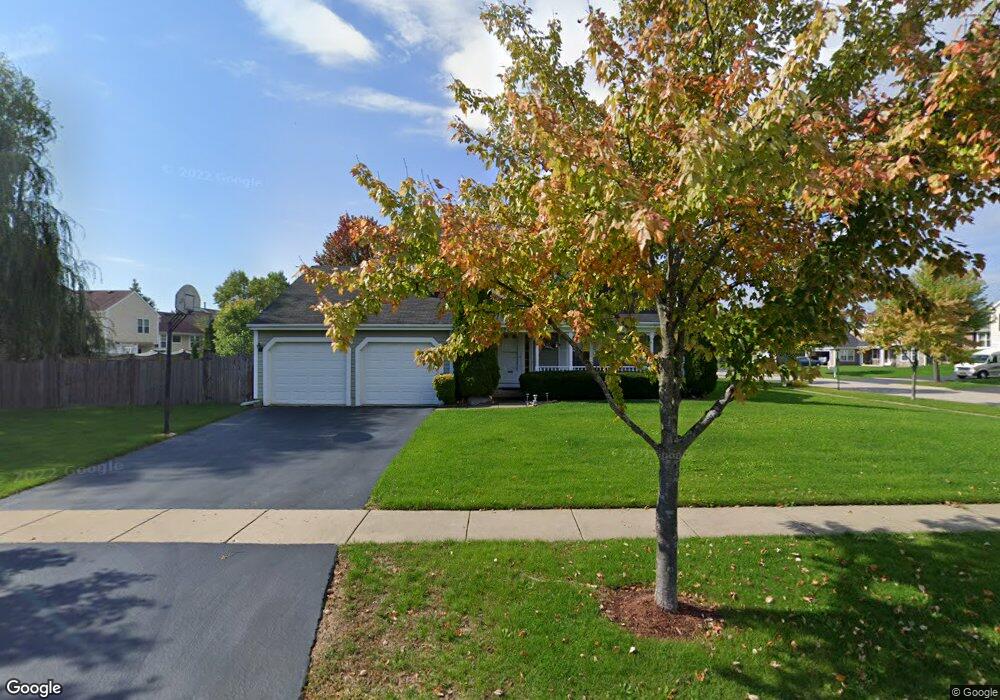
1209 Westport Ridge Crystal Lake, IL 60014
Estimated Value: $359,517 - $406,000
3
Beds
3
Baths
1,820
Sq Ft
$211/Sq Ft
Est. Value
About This Home
This home is located at 1209 Westport Ridge, Crystal Lake, IL 60014 and is currently estimated at $384,129, approximately $211 per square foot. 1209 Westport Ridge is a home located in McHenry County with nearby schools including Indian Prairie Elementary School, Lundahl Middle School, and Crystal Lake South High School.
Ownership History
Date
Name
Owned For
Owner Type
Purchase Details
Closed on
Dec 22, 2003
Sold by
Kiemel Evelyn C
Bought by
Kiemel William O
Current Estimated Value
Purchase Details
Closed on
Jun 30, 1998
Sold by
Thompson Ron F and Thompson Rebecca O
Bought by
Kiemel William O and Kiemel Evelyn C
Home Financials for this Owner
Home Financials are based on the most recent Mortgage that was taken out on this home.
Original Mortgage
$90,000
Outstanding Balance
$18,707
Interest Rate
7.18%
Estimated Equity
$365,422
Purchase Details
Closed on
Jul 28, 1994
Sold by
Westholme Partners
Bought by
Thompson Ron F and Thompson Rebecca O
Home Financials for this Owner
Home Financials are based on the most recent Mortgage that was taken out on this home.
Original Mortgage
$127,040
Interest Rate
8.62%
Create a Home Valuation Report for This Property
The Home Valuation Report is an in-depth analysis detailing your home's value as well as a comparison with similar homes in the area
Home Values in the Area
Average Home Value in this Area
Purchase History
| Date | Buyer | Sale Price | Title Company |
|---|---|---|---|
| Kiemel William O | -- | -- | |
| Kiemel William O | $177,500 | Universal Title Services Inc | |
| Thompson Ron F | $160,500 | First American Title |
Source: Public Records
Mortgage History
| Date | Status | Borrower | Loan Amount |
|---|---|---|---|
| Open | Kiemel William O | $90,000 | |
| Previous Owner | Thompson Ron F | $127,040 |
Source: Public Records
Tax History Compared to Growth
Tax History
| Year | Tax Paid | Tax Assessment Tax Assessment Total Assessment is a certain percentage of the fair market value that is determined by local assessors to be the total taxable value of land and additions on the property. | Land | Improvement |
|---|---|---|---|---|
| 2024 | $7,169 | $102,677 | $23,836 | $78,841 |
| 2023 | $6,798 | $91,831 | $21,318 | $70,513 |
| 2022 | $7,649 | $93,753 | $25,480 | $68,273 |
| 2021 | $7,180 | $87,342 | $23,738 | $63,604 |
| 2020 | $6,971 | $84,250 | $22,898 | $61,352 |
| 2019 | $6,752 | $80,637 | $21,916 | $58,721 |
| 2018 | $6,263 | $74,492 | $20,246 | $54,246 |
| 2017 | $6,388 | $70,176 | $19,073 | $51,103 |
| 2016 | $5,957 | $65,819 | $17,889 | $47,930 |
| 2013 | -- | $62,185 | $16,688 | $45,497 |
Source: Public Records
Map
Nearby Homes
- 518 Silver Aspen Cir
- 542 Silver Aspen Cir
- 1391 Acadia Cir
- 1421 Acadia Cir
- 1451 Acadia Cir
- 1441 Acadia Cir
- 1461 Acadia Cir
- 645 Kendallwood Ct
- 1549 Brompton Ln
- 796 Waterford Cut
- 1420 Trailwood Dr
- 1549 Hollytree Ln Unit 2
- 894 N Brentwood Dr
- 1668 Penn Ct Unit A
- 1542 Candlewood Dr
- 1201 Boxwood Dr
- 929 Golf Course Rd Unit 4
- 1655 Kennsington Ln
- 160 Surrey Ln
- 677 Barlina Rd
- 529 Monarch Dr
- 1199 Westport Ridge
- 533 Monarch Dr
- 1189 Westport Ridge
- 1208 Westport Ridge
- 1212 Westport Ridge
- 528 Monarch Dr
- 1204 Westport Ridge
- 532 Monarch Dr
- 1216 Westport Ridge
- 1185 Westport Ridge
- 537 Monarch Dr
- 1200 Westport Ridge
- 536 Monarch Dr
- 1196 Westport Ridge
- 1181 Westport Ridge
- 1218 Westport Ridge
- 1192 Westport Ridge
- 540 Monarch Dr
- 541 Monarch Dr