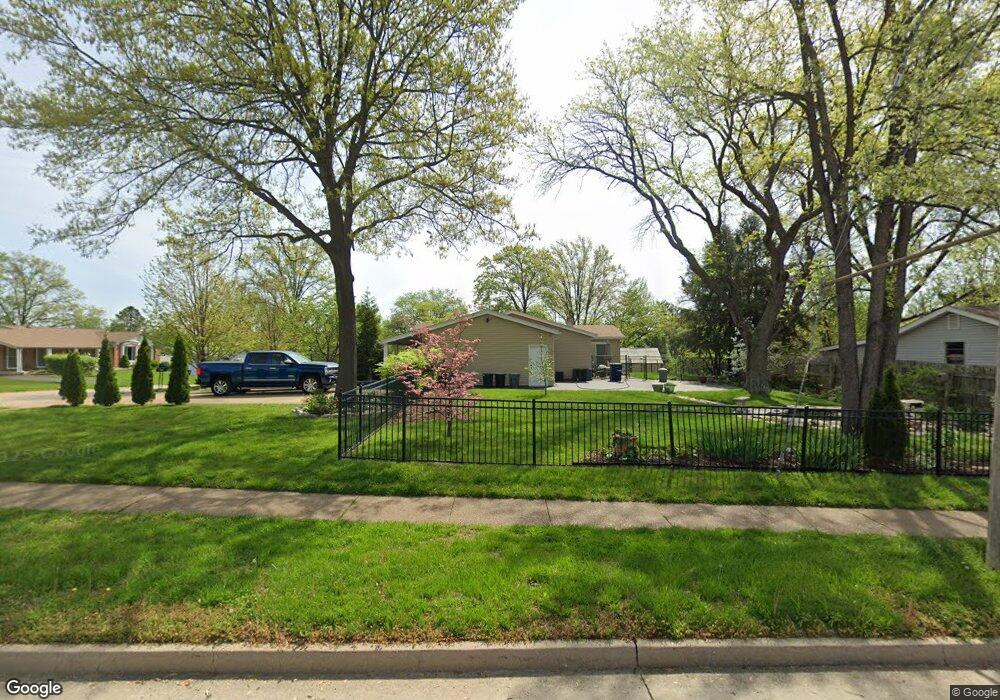
12096 Tangletree Dr Saint Louis, MO 63146
Estimated Value: $375,952 - $433,000
3
Beds
2
Baths
1,786
Sq Ft
$225/Sq Ft
Est. Value
About This Home
This home is located at 12096 Tangletree Dr, Saint Louis, MO 63146 and is currently estimated at $401,988, approximately $225 per square foot. 12096 Tangletree Dr is a home located in St. Louis County with nearby schools including Craig Elementary School, Parkway Northeast Middle School, and Parkway North High School.
Ownership History
Date
Name
Owned For
Owner Type
Purchase Details
Closed on
Sep 19, 2011
Sold by
Feeler Ryan and Feeler Alissha G
Bought by
Greenburg Jeffrey A
Current Estimated Value
Home Financials for this Owner
Home Financials are based on the most recent Mortgage that was taken out on this home.
Original Mortgage
$100,000
Outstanding Balance
$8,872
Interest Rate
4.34%
Mortgage Type
New Conventional
Estimated Equity
$393,116
Purchase Details
Closed on
Apr 12, 2001
Sold by
Cohen Carolyn S and Harris Harvey A
Bought by
Feeler Courtney Ryan and Feeler Alissha G
Home Financials for this Owner
Home Financials are based on the most recent Mortgage that was taken out on this home.
Original Mortgage
$128,000
Interest Rate
6.96%
Purchase Details
Closed on
Jul 7, 1999
Sold by
Cohen Carolyn S
Bought by
Cohen Linda Marie
Create a Home Valuation Report for This Property
The Home Valuation Report is an in-depth analysis detailing your home's value as well as a comparison with similar homes in the area
Home Values in the Area
Average Home Value in this Area
Purchase History
| Date | Buyer | Sale Price | Title Company |
|---|---|---|---|
| Greenburg Jeffrey A | $168,500 | Investors Title Co Clayton | |
| Feeler Courtney Ryan | $160,000 | -- | |
| Cohen Linda Marie | -- | -- |
Source: Public Records
Mortgage History
| Date | Status | Borrower | Loan Amount |
|---|---|---|---|
| Open | Greenburg Jeffrey A | $100,000 | |
| Previous Owner | Feeler Courtney Ryan | $128,000 |
Source: Public Records
Tax History Compared to Growth
Tax History
| Year | Tax Paid | Tax Assessment Tax Assessment Total Assessment is a certain percentage of the fair market value that is determined by local assessors to be the total taxable value of land and additions on the property. | Land | Improvement |
|---|---|---|---|---|
| 2025 | $4,058 | $66,020 | $31,480 | $34,540 |
| 2024 | $4,058 | $62,020 | $21,000 | $41,020 |
| 2023 | $4,006 | $62,020 | $21,000 | $41,020 |
| 2022 | $3,503 | $49,410 | $21,000 | $28,410 |
| 2021 | $3,478 | $49,410 | $21,000 | $28,410 |
| 2020 | $3,427 | $46,490 | $20,120 | $26,370 |
| 2019 | $3,373 | $46,490 | $20,120 | $26,370 |
| 2018 | $3,335 | $42,430 | $17,310 | $25,120 |
| 2017 | $3,311 | $42,430 | $17,310 | $25,120 |
| 2016 | $3,191 | $38,890 | $13,870 | $25,020 |
| 2015 | $3,327 | $38,890 | $13,870 | $25,020 |
| 2014 | $3,056 | $38,160 | $8,820 | $29,340 |
Source: Public Records
Map
Nearby Homes
- 12167 Plainsman Dr
- 11861 Spruce Orchard Dr
- 11983 Villa Dorado Dr Unit 211
- 12045 Bridal Shire Ct
- 1425 Craig Rd
- 12371 Sparrowhawk Ct
- 11921 Villa Dorado Dr Unit A
- 12314 Rossridge Ct
- 11825 Villa Dorado Dr
- 1529 Tryon Dr
- 11741 Casa Grande Dr Unit G
- 11714 Casa Grande Dr
- 1072 King Carey Dr
- 1033 Mackinac Dr
- 1407 Summerhaven Dr
- 1226 Hyannis Dr
- 1747 Russet Valley Dr Unit 63
- 11993 Moorland Manor Ct
- 1722 Robin Knoll Ct
- 12558 Pepperwood Dr
- 1616 Craig Rd
- 12084 Tangletree Dr
- 12095 Tangletree Dr
- 12076 Tangletree Dr
- 12087 Tangletree Dr
- 1624 Fahrpark Ct
- 1628 Fahrpark Ct
- 12079 Tangletree Dr
- 1650 Craig Rd
- 12068 Tangletree Dr
- 12071 Tangletree Dr
- 1618 Fahrpark Ct
- 1656 Craig Rd
- 12107 Fahrpark Ln
- 12112 Fahrpark Ln
- 12060 Tangletree Dr
- 12063 Tangletree Dr
- 12032 Greenwalk Dr
- 1612 Fahrpark Ct
- 12040 Greenwalk Dr