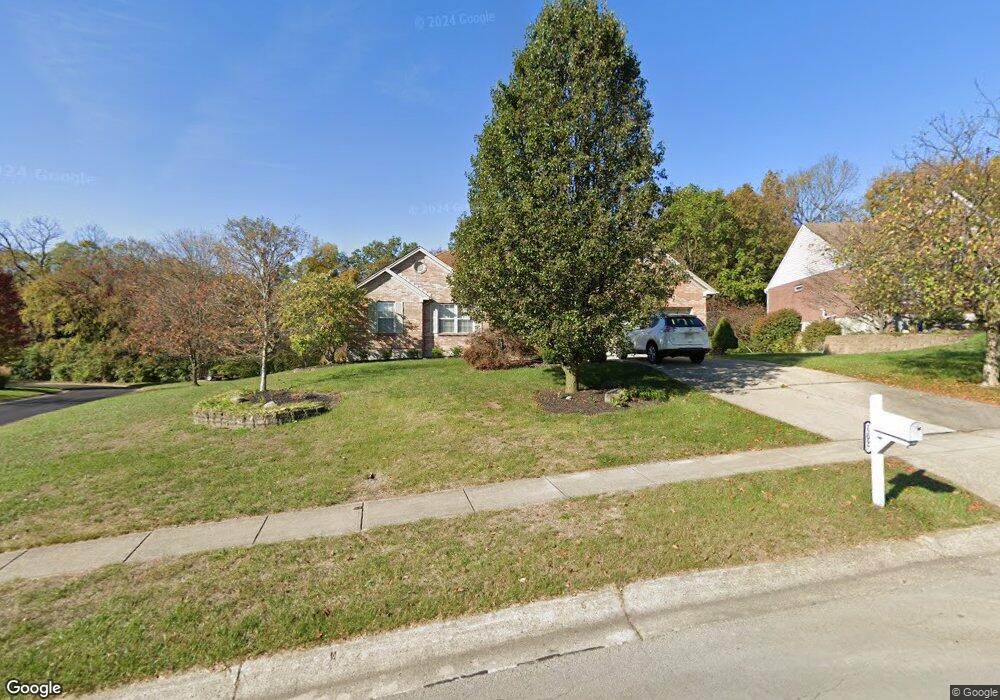
12097 Kilbride Dr Cincinnati, OH 45251
Estimated Value: $373,000 - $440,000
3
Beds
2
Baths
1,792
Sq Ft
$221/Sq Ft
Est. Value
About This Home
This home is located at 12097 Kilbride Dr, Cincinnati, OH 45251 and is currently estimated at $395,199, approximately $220 per square foot. 12097 Kilbride Dr is a home located in Hamilton County with nearby schools including Pleasant Run Elementary School, Pleasant Run Middle School, and Northwest High School.
Ownership History
Date
Name
Owned For
Owner Type
Purchase Details
Closed on
Jun 29, 2007
Sold by
Settle Joe and Settle Sherri A
Bought by
Bradam Thomas and Bradam Joanne
Current Estimated Value
Purchase Details
Closed on
Feb 1, 2001
Sold by
Meyer Builders Douglas Homes Ltd
Bought by
Settle Joe and Settle Sherri A
Home Financials for this Owner
Home Financials are based on the most recent Mortgage that was taken out on this home.
Original Mortgage
$100,000
Outstanding Balance
$36,392
Interest Rate
7.18%
Estimated Equity
$358,807
Purchase Details
Closed on
Oct 2, 2000
Sold by
Hunterston Llc Ltd
Bought by
Meyer Builders Douglas Homes Ltd
Home Financials for this Owner
Home Financials are based on the most recent Mortgage that was taken out on this home.
Original Mortgage
$1,755,415
Interest Rate
7.96%
Create a Home Valuation Report for This Property
The Home Valuation Report is an in-depth analysis detailing your home's value as well as a comparison with similar homes in the area
Home Values in the Area
Average Home Value in this Area
Purchase History
| Date | Buyer | Sale Price | Title Company |
|---|---|---|---|
| Bradam Thomas | $253,000 | Attorney | |
| Settle Joe | $199,100 | Vintage Title Agency Inc | |
| Meyer Builders Douglas Homes Ltd | $450,000 | -- |
Source: Public Records
Mortgage History
| Date | Status | Borrower | Loan Amount |
|---|---|---|---|
| Open | Settle Joe | $100,000 | |
| Closed | Meyer Builders Douglas Homes Ltd | $1,755,415 |
Source: Public Records
Tax History Compared to Growth
Tax History
| Year | Tax Paid | Tax Assessment Tax Assessment Total Assessment is a certain percentage of the fair market value that is determined by local assessors to be the total taxable value of land and additions on the property. | Land | Improvement |
|---|---|---|---|---|
| 2024 | $5,368 | $108,784 | $12,425 | $96,359 |
| 2023 | $5,440 | $108,784 | $12,425 | $96,359 |
| 2022 | $3,516 | $60,746 | $9,555 | $51,191 |
| 2021 | $3,473 | $60,746 | $9,555 | $51,191 |
| 2020 | $3,521 | $60,746 | $9,555 | $51,191 |
| 2019 | $3,753 | $60,746 | $9,555 | $51,191 |
| 2018 | $3,375 | $60,746 | $9,555 | $51,191 |
| 2017 | $3,194 | $60,746 | $9,555 | $51,191 |
| 2016 | $3,447 | $64,397 | $10,658 | $53,739 |
| 2015 | $3,488 | $64,397 | $10,658 | $53,739 |
| 2014 | $3,494 | $64,397 | $10,658 | $53,739 |
| 2013 | $3,907 | $74,018 | $12,250 | $61,768 |
Source: Public Records
Map
Nearby Homes
- 12190 Kilbride Dr
- 3169 John Gray Rd
- 1235 Bruton Parish Way
- 11916 Abbeytown Dr
- 11955 Merrion Ct
- 11992 Pippin Rd
- 12003 Westerly Dr
- 6367 Jamesfield Ct
- 2681 Haverknoll Dr
- 2605 Retford Dr
- 2617 Haverknoll Dr
- 2545 Haverknoll Dr
- 11586 Pippin Rd
- 1481 Becker Dr
- 1605 W Augusta Blvd
- 27 Carousel Cir
- 12120 Regency Run Ct
- 11492 Pippin Rd
- 1523 Hunter Rd
- 1515 Gelhot Dr
- 12101 Kilbride Dr
- 12083 Kilbride Dr
- 12085 Kilbride Dr
- 12107 Kilbride Dr
- 12092 Kilbride Dr
- 12077 Kilbride Dr
- 12080 Kilbride Dr
- 12104 Kilbride Dr
- 12087 Kilbride Dr
- 12111 Kilbride Dr
- 12110 Kilbride Dr
- 12089 Kilbride Dr
- 12115 Kilbride Dr
- 12073 Kilbride Dr
- 12072 Kilbride Dr
- 12116 Kilbride Dr
- 12091 Kilbride Dr
- 12123 Kilbride Dr
- 12065 Kilbride Dr
- 12064 Kilbride Dr