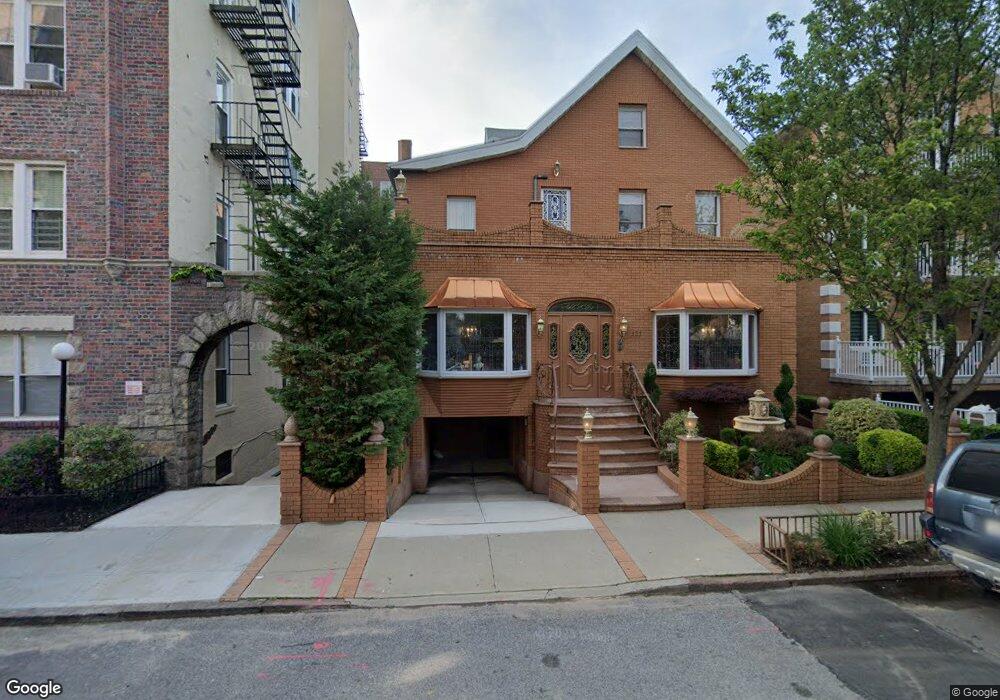
121-121A 97th St Unit 1A Brooklyn, NY 11209
Fort Hamilton NeighborhoodEstimated Value: $1,055,000 - $1,286,000
--
Bed
--
Bath
1,594
Sq Ft
$741/Sq Ft
Est. Value
About This Home
This home is located at 121-121A 97th St Unit 1A, Brooklyn, NY 11209 and is currently estimated at $1,181,567, approximately $741 per square foot. 121-121A 97th St Unit 1A is a home located in Kings County with nearby schools including P.S./I.S. 104 The Fort Hamilton School, Fort Hamilton High School, and Visitation Academy.
Ownership History
Date
Name
Owned For
Owner Type
Purchase Details
Closed on
Jan 30, 2024
Sold by
Inglese Lucille and Inglese Pasquale
Bought by
Puleri Dorian and Russell-Puleri Sparkle
Current Estimated Value
Home Financials for this Owner
Home Financials are based on the most recent Mortgage that was taken out on this home.
Original Mortgage
$766,550
Outstanding Balance
$752,250
Interest Rate
6.61%
Mortgage Type
Purchase Money Mortgage
Estimated Equity
$429,317
Purchase Details
Closed on
Oct 30, 2001
Sold by
Tiana Associates Llc
Bought by
Inglese Pasquale and Inglese Lucille
Home Financials for this Owner
Home Financials are based on the most recent Mortgage that was taken out on this home.
Original Mortgage
$90,000
Interest Rate
6.67%
Mortgage Type
Purchase Money Mortgage
Create a Home Valuation Report for This Property
The Home Valuation Report is an in-depth analysis detailing your home's value as well as a comparison with similar homes in the area
Home Values in the Area
Average Home Value in this Area
Purchase History
| Date | Buyer | Sale Price | Title Company |
|---|---|---|---|
| Puleri Dorian | $1,070,000 | -- | |
| Puleri Dorian | $1,070,000 | -- | |
| Inglese Pasquale | -- | -- | |
| Inglese Pasquale | -- | -- |
Source: Public Records
Mortgage History
| Date | Status | Borrower | Loan Amount |
|---|---|---|---|
| Open | Puleri Dorian | $766,550 | |
| Closed | Puleri Dorian | $766,550 | |
| Previous Owner | Inglese Pasquale | $90,000 |
Source: Public Records
Tax History Compared to Growth
Tax History
| Year | Tax Paid | Tax Assessment Tax Assessment Total Assessment is a certain percentage of the fair market value that is determined by local assessors to be the total taxable value of land and additions on the property. | Land | Improvement |
|---|---|---|---|---|
| 2025 | $7,369 | $87,997 | $2,333 | $85,664 |
| 2024 | $7,369 | $73,539 | $2,333 | $71,206 |
| 2023 | $7,030 | $73,563 | $2,333 | $71,230 |
| 2022 | $6,423 | $67,841 | $2,333 | $65,508 |
| 2021 | $6,150 | $61,850 | $2,333 | $59,517 |
| 2020 | $4,889 | $60,788 | $2,333 | $58,455 |
| 2019 | $6,103 | $54,521 | $2,333 | $52,188 |
| 2018 | $5,582 | $28,844 | $1,050 | $27,794 |
| 2017 | $5,248 | $27,212 | $1,068 | $26,144 |
| 2016 | $4,320 | $25,672 | $1,096 | $24,576 |
| 2015 | $733 | $25,672 | $1,251 | $24,421 |
| 2014 | $733 | $25,478 | $1,497 | $23,981 |
Source: Public Records
Map
Nearby Homes
- 9615 Shore Rd Unit 2G
- 9701 Shore Rd Unit 5L
- 9701 Shore Rd Unit 1O
- 129 97th St
- 9511 Shore Rd Unit 606
- 9511 Shore Rd Unit 107
- 9511 Shore Rd Unit 505
- 9801 Shore Rd Unit 4P
- 9801 Shore Rd Unit 1K
- 9801 Shore Rd Unit 2B
- 9437 Shore Rd Unit E-6
- 9437 Shore Rd Unit E8
- 145 99th St
- 145 95th St Unit E3
- 9425 Shore Rd Unit 2J
- 9902 3rd Ave Unit 6I
- 9902 3rd Ave Unit 1M
- 9917 Shore Rd Unit 5A
- 9917 Shore Rd Unit 8B
- 9917 Shore Rd Unit 7C
- 121A 97th St Unit 3A
- 121A 97th St Unit 2A
- 123A 97th St Unit 3B
- 123A 97th St Unit 2B
- 123A 97th St Unit 2
- 123A 97th St Unit 1A
- 123A 97th St
- 123 97th St Unit 123A
- 123 97th St
- 121 97th St Unit 121A
- 121 97th St Unit 121A
- 121 97th St
- 121 97th St Unit 1A
- 127 97th St
- 9701 Shore Rd Unit 10
- 9701 Shore Rd Unit 91
- 9701 Shore Rd Unit 1F Brooklyn, NY
- 9701 Shore Rd Unit 1N
- 9701 Shore Rd Unit 1J
- 9701 Shore Rd Unit 3C