
Seller's Agent in 2017
Hayden Thornburg
Thornburg & Associates, Inc.
(828) 816-1772
36 Total Sales
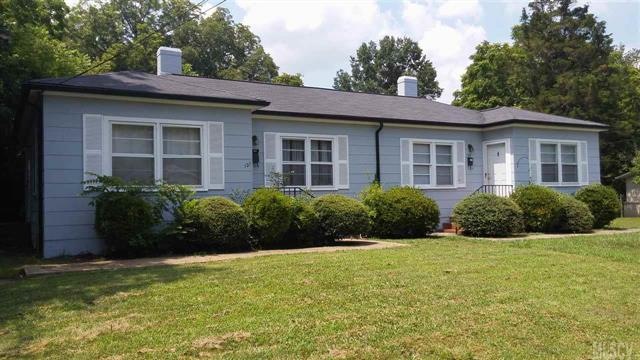
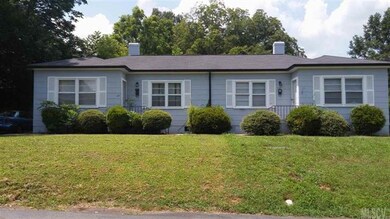


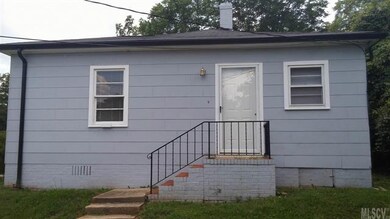
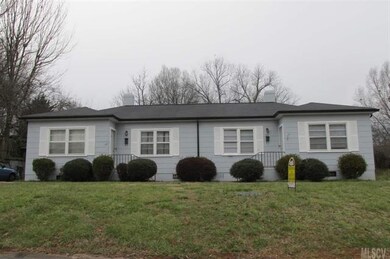
This Conover duplex is the investment opportunity you've been searching for. Currently, 100% renter occupied, this property yields $10,080 gross income at current rent amounts of $425/month for unit 1 and $450/month for unit 2. Property includes one out-building equipped with laundry facilities.
Last Agent to Sell the Property
Thornburg & Associates, Inc. License #288437 Listed on: 07/27/2016
| Date | Event | Price | List to Sale | Price per Sq Ft |
|---|---|---|---|---|
| 11/22/2017 11/22/17 | Sold | $69,500 | -22.8% | $48 / Sq Ft |
| 10/13/2017 10/13/17 | Pending | -- | -- | -- |
| 07/27/2016 07/27/16 | For Sale | $90,000 | -- | $62 / Sq Ft |
| Year | Tax Paid | Tax Assessment Tax Assessment Total Assessment is a certain percentage of the fair market value that is determined by local assessors to be the total taxable value of land and additions on the property. | Land | Improvement |
|---|---|---|---|---|
| 2025 | $1,150 | $144,900 | $5,700 | $139,200 |
| 2024 | $1,150 | $144,900 | $5,700 | $139,200 |
| 2023 | $1,150 | $144,900 | $5,700 | $139,200 |
| 2022 | $688 | $64,000 | $5,700 | $58,300 |
| 2021 | $688 | $64,000 | $5,700 | $58,300 |
| 2020 | $688 | $64,000 | $5,700 | $58,300 |
| 2019 | $688 | $64,000 | $0 | $0 |
| 2018 | $771 | $71,700 | $5,700 | $66,000 |
| 2017 | $749 | $0 | $0 | $0 |
| 2016 | $749 | $0 | $0 | $0 |
| 2015 | $725 | $71,650 | $5,700 | $65,950 |
| 2014 | $725 | $78,000 | $8,000 | $70,000 |
Seller's Agent in 2017
Hayden Thornburg
Thornburg & Associates, Inc.
(828) 816-1772
36 Total Sales
Buyer's Agent in 2017
Gail Ketchie
Leaders Realty Group
(828) 310-1717
1 in this area
21 Total Sales
Source: Canopy MLS
MLS Number: CAR9589400
APN: 3741-05-29-1257
Disclaimer: Certain information contained herein is derived from information provided by parties other than Homes.com. All information provided is deemed reliable, but is not guaranteed to be accurate and should be independently verified.
![]() All data is obtained from various sources and may not have been verified by broker or MLS GRID. Supplied Open House Information is subject to change without notice. All information should be independently reviewed and verified for accuracy. Properties may or may not be listed by the office/agent presenting the information. Some IDX listings have been excluded from this website.
All data is obtained from various sources and may not have been verified by broker or MLS GRID. Supplied Open House Information is subject to change without notice. All information should be independently reviewed and verified for accuracy. Properties may or may not be listed by the office/agent presenting the information. Some IDX listings have been excluded from this website.
Based on information submitted to the MLS GRID
Ask me questions while you tour the home.