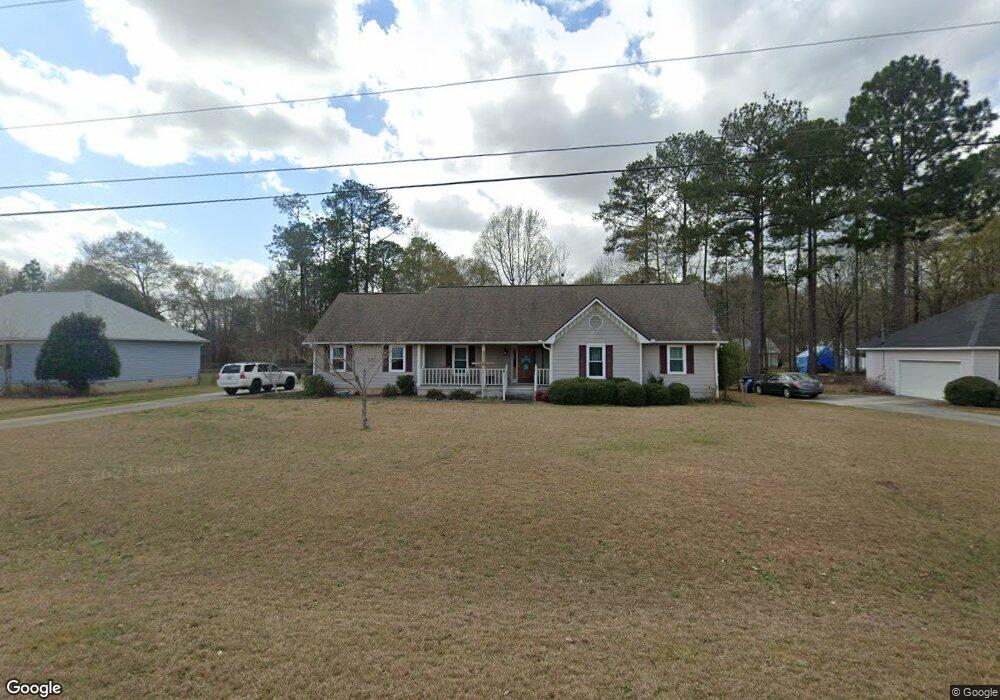
121 Alan Ct Macon, GA 31216
Estimated Value: $251,000 - $277,000
3
Beds
2
Baths
1,881
Sq Ft
$140/Sq Ft
Est. Value
About This Home
This home is located at 121 Alan Ct, Macon, GA 31216 and is currently estimated at $262,833, approximately $139 per square foot. 121 Alan Ct is a home located in Bibb County with nearby schools including Heard Elementary School, Rutland Middle School, and Rutland High School.
Ownership History
Date
Name
Owned For
Owner Type
Purchase Details
Closed on
Mar 25, 2025
Sold by
Cosey Karen W
Bought by
Cosey John M
Current Estimated Value
Home Financials for this Owner
Home Financials are based on the most recent Mortgage that was taken out on this home.
Original Mortgage
$175,000
Outstanding Balance
$173,952
Interest Rate
6.87%
Mortgage Type
New Conventional
Estimated Equity
$88,881
Purchase Details
Closed on
Mar 14, 1996
Sold by
Kiser Mark A and Kiser Kimberly M
Bought by
Cosey John M and Cosey Karen W
Create a Home Valuation Report for This Property
The Home Valuation Report is an in-depth analysis detailing your home's value as well as a comparison with similar homes in the area
Purchase History
| Date | Buyer | Sale Price | Title Company |
|---|---|---|---|
| Cosey John M | -- | None Listed On Document | |
| Cosey John M | -- | None Listed On Document | |
| Cosey John M | $94,500 | -- |
Source: Public Records
Mortgage History
| Date | Status | Borrower | Loan Amount |
|---|---|---|---|
| Open | Cosey John M | $175,000 | |
| Closed | Cosey John M | $175,000 |
Source: Public Records
Tax History
| Year | Tax Paid | Tax Assessment Tax Assessment Total Assessment is a certain percentage of the fair market value that is determined by local assessors to be the total taxable value of land and additions on the property. | Land | Improvement |
|---|---|---|---|---|
| 2025 | $2,240 | $98,148 | $8,480 | $89,668 |
| 2024 | $2,167 | $92,330 | $8,480 | $83,850 |
| 2023 | $2,000 | $74,513 | $8,480 | $66,033 |
| 2022 | $1,999 | $64,745 | $6,678 | $58,067 |
| 2021 | $2,194 | $64,745 | $6,678 | $58,067 |
| 2020 | $2,031 | $59,310 | $6,010 | $53,300 |
| 2019 | $1,932 | $56,363 | $6,010 | $50,353 |
| 2018 | $2,923 | $52,749 | $5,342 | $47,407 |
| 2017 | $1,714 | $52,749 | $5,342 | $47,407 |
| 2016 | $1,583 | $52,749 | $5,342 | $47,407 |
| 2015 | $2,223 | $52,390 | $5,342 | $47,047 |
| 2014 | $2,398 | $55,880 | $5,342 | $50,537 |
Source: Public Records
Map
Nearby Homes
- 201 Liberty Trace
- 261 Amanda Dr
- 224 Liberty Trace
- 268 Amanda Dr
- 297 Amanda Dr
- 6045 Cara Dr
- 2800 S Estates Rd
- 350 Browning Pointe Rd
- 3150 Holleman Dr
- 2813 S Estates Rd
- 344 Browning Pointe Rd
- 6414 Ponderosa Dr
- 116 Fred Ct
- 6530 Bevin Dr
- 308 Ellis Ct
- 4057 Liberty Estates Dr
- 6670 Fran Dr
- 5758 Shelli Place
- 3708 Jones Rd
- 3720 Dean Dr
Your Personal Tour Guide
Ask me questions while you tour the home.