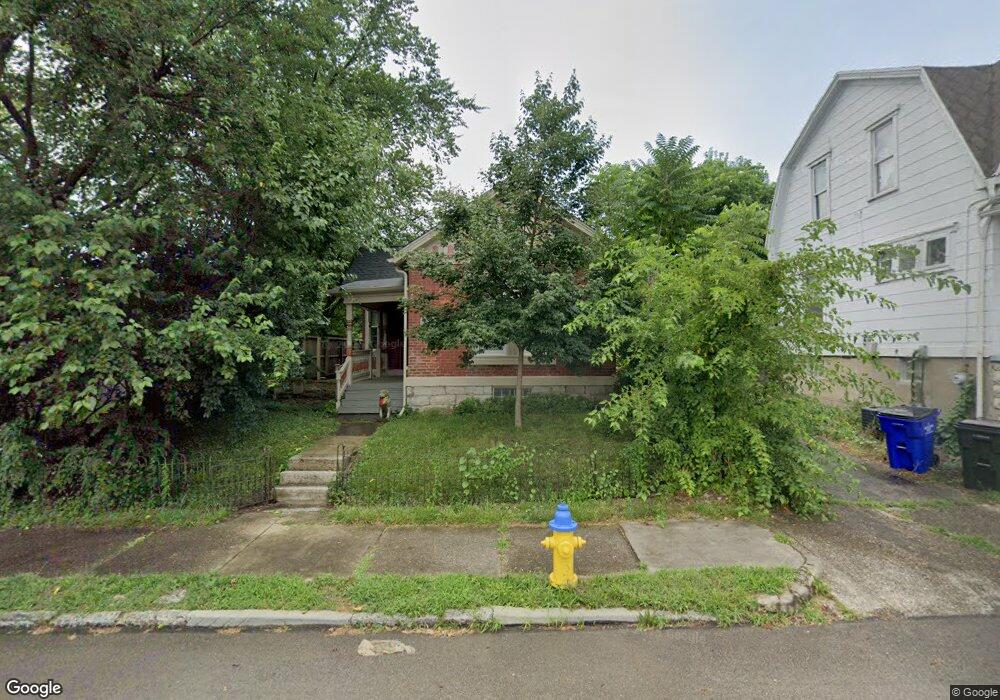
121 Alberta St Dayton, OH 45410
South Park NeighborhoodEstimated Value: $174,000 - $218,000
3
Beds
2
Baths
1,293
Sq Ft
$150/Sq Ft
Est. Value
About This Home
This home is located at 121 Alberta St, Dayton, OH 45410 and is currently estimated at $194,003, approximately $150 per square foot. 121 Alberta St is a home located in Montgomery County with nearby schools including Ruskin Elementary School, Kiser Elementary, and Emerson Academy.
Ownership History
Date
Name
Owned For
Owner Type
Purchase Details
Closed on
Feb 6, 2015
Sold by
Secretary Of Hud
Bought by
Stephens Karen L and Stephens Elyanor G
Current Estimated Value
Purchase Details
Closed on
Sep 26, 2014
Sold by
Wright Patt Credit Union Inc
Bought by
Secretary Of Hud
Purchase Details
Closed on
Mar 15, 2011
Sold by
Rhea Allison F and Moye Nicholas
Bought by
Grande Christopher R
Home Financials for this Owner
Home Financials are based on the most recent Mortgage that was taken out on this home.
Original Mortgage
$89,637
Interest Rate
5.5%
Mortgage Type
FHA
Purchase Details
Closed on
Aug 26, 2008
Sold by
Union Savings Bank
Bought by
Rhea Allison F
Purchase Details
Closed on
May 20, 2008
Sold by
Blue Sky Construction Llc
Bought by
Union Savings Bank
Purchase Details
Closed on
Jun 5, 2003
Sold by
Manos Family Trust and Doris N
Bought by
Betts Robert and Betts Carol
Home Financials for this Owner
Home Financials are based on the most recent Mortgage that was taken out on this home.
Original Mortgage
$53,531
Interest Rate
5.91%
Mortgage Type
Construction
Create a Home Valuation Report for This Property
The Home Valuation Report is an in-depth analysis detailing your home's value as well as a comparison with similar homes in the area
Home Values in the Area
Average Home Value in this Area
Purchase History
| Date | Buyer | Sale Price | Title Company |
|---|---|---|---|
| Stephens Karen L | $54,000 | None Available | |
| Secretary Of Hud | -- | None Available | |
| Grande Christopher R | $92,000 | Attorney | |
| Rhea Allison F | $17,500 | Attorney | |
| Union Savings Bank | $29,000 | None Available | |
| Betts Robert | $32,500 | Metropolitan Title Company |
Source: Public Records
Mortgage History
| Date | Status | Borrower | Loan Amount |
|---|---|---|---|
| Previous Owner | Grande Christopher R | $89,637 | |
| Previous Owner | Betts Robert | $53,531 |
Source: Public Records
Tax History
| Year | Tax Paid | Tax Assessment Tax Assessment Total Assessment is a certain percentage of the fair market value that is determined by local assessors to be the total taxable value of land and additions on the property. | Land | Improvement |
|---|---|---|---|---|
| 2025 | $3,161 | $53,280 | $12,580 | $40,700 |
| 2024 | $3,031 | $53,280 | $12,580 | $40,700 |
| 2023 | $3,031 | $53,280 | $12,580 | $40,700 |
| 2022 | $2,932 | $39,530 | $9,320 | $30,210 |
| 2021 | $2,916 | $39,530 | $9,320 | $30,210 |
| 2020 | $2,911 | $39,530 | $9,320 | $30,210 |
| 2019 | $2,692 | $32,880 | $9,320 | $23,560 |
| 2018 | $2,696 | $32,880 | $9,320 | $23,560 |
| 2017 | $2,675 | $32,880 | $9,320 | $23,560 |
| 2016 | $2,926 | $34,350 | $9,320 | $25,030 |
| 2015 | $2,902 | $34,350 | $9,320 | $25,030 |
| 2014 | $2,902 | $34,350 | $9,320 | $25,030 |
| 2012 | -- | $30,750 | $9,140 | $21,610 |
Source: Public Records
Map
Nearby Homes
Your Personal Tour Guide
Ask me questions while you tour the home.