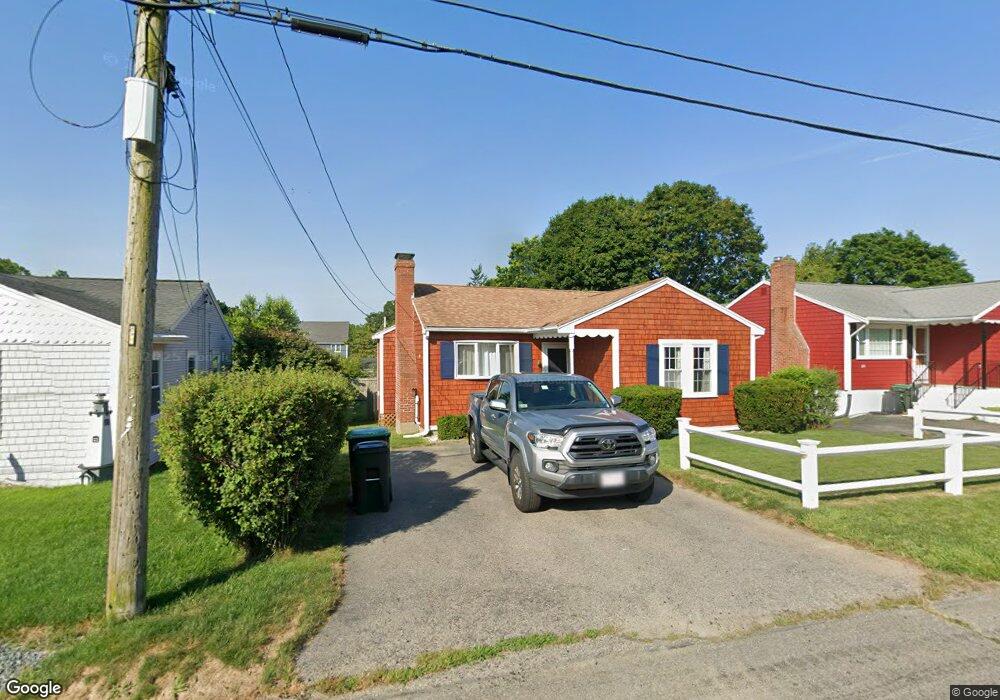
121 Arnold Rd Marshfield, MA 02050
Ocean Bluff-Brant Rock NeighborhoodEstimated Value: $494,000 - $570,000
2
Beds
1
Bath
816
Sq Ft
$657/Sq Ft
Est. Value
About This Home
This home is located at 121 Arnold Rd, Marshfield, MA 02050 and is currently estimated at $536,239, approximately $657 per square foot. 121 Arnold Rd is a home located in Plymouth County with nearby schools including Governor Edward Winslow School, Furnace Brook Middle School, and Marshfield High School.
Ownership History
Date
Name
Owned For
Owner Type
Purchase Details
Closed on
May 15, 2006
Sold by
Simpson Jeffrey C
Bought by
Shea Robert W
Current Estimated Value
Home Financials for this Owner
Home Financials are based on the most recent Mortgage that was taken out on this home.
Original Mortgage
$240,000
Interest Rate
6.4%
Mortgage Type
Purchase Money Mortgage
Purchase Details
Closed on
Aug 18, 2004
Sold by
Simpson Patricia A and Simpson Jeffrey C
Bought by
Simpson Jeffrey C
Purchase Details
Closed on
Apr 27, 2001
Sold by
Abell Jason C and Abell Lora
Bought by
Simpson Jeffrey C and Sullen Patricia A
Purchase Details
Closed on
Mar 21, 1997
Sold by
Norton Cheryl A
Bought by
Abell Jason C and Abell Lora A
Purchase Details
Closed on
May 6, 1993
Sold by
Norman Bradford V and Norman Verne G
Bought by
Stack Cynthia M
Purchase Details
Closed on
Mar 6, 1989
Sold by
Mottley Dennis J
Bought by
Norman Bradford V
Create a Home Valuation Report for This Property
The Home Valuation Report is an in-depth analysis detailing your home's value as well as a comparison with similar homes in the area
Home Values in the Area
Average Home Value in this Area
Purchase History
| Date | Buyer | Sale Price | Title Company |
|---|---|---|---|
| Shea Robert W | $300,000 | -- | |
| Shea Robert W | $300,000 | -- | |
| Simpson Jeffrey C | -- | -- | |
| Simpson Jeffrey C | -- | -- | |
| Simpson Jeffrey C | $192,900 | -- | |
| Simpson Jeffrey C | $192,900 | -- | |
| Abell Jason C | $110,000 | -- | |
| Abell Jason C | $110,000 | -- | |
| Stack Cynthia M | $105,500 | -- | |
| Norman Bradford V | $120,000 | -- |
Source: Public Records
Mortgage History
| Date | Status | Borrower | Loan Amount |
|---|---|---|---|
| Open | Norman Bradford V | $237,000 | |
| Closed | Norman Bradford V | $240,000 |
Source: Public Records
Tax History
| Year | Tax Paid | Tax Assessment Tax Assessment Total Assessment is a certain percentage of the fair market value that is determined by local assessors to be the total taxable value of land and additions on the property. | Land | Improvement |
|---|---|---|---|---|
| 2025 | $4,745 | $479,300 | $317,600 | $161,700 |
| 2024 | $4,699 | $452,300 | $297,800 | $154,500 |
| 2023 | $4,500 | $395,900 | $268,000 | $127,900 |
| 2022 | $4,500 | $347,500 | $228,300 | $119,200 |
| 2021 | $4,291 | $325,300 | $218,400 | $106,900 |
| 2020 | $3,858 | $289,400 | $188,600 | $100,800 |
| 2019 | $3,791 | $283,300 | $188,600 | $94,700 |
| 2018 | $3,788 | $283,300 | $188,600 | $94,700 |
| 2017 | $3,586 | $261,400 | $178,700 | $82,700 |
| 2016 | $3,489 | $251,400 | $168,700 | $82,700 |
| 2015 | $3,341 | $251,400 | $168,700 | $82,700 |
| 2014 | $3,342 | $251,500 | $168,700 | $82,800 |
Source: Public Records
Map
Nearby Homes
Your Personal Tour Guide
Ask me questions while you tour the home.