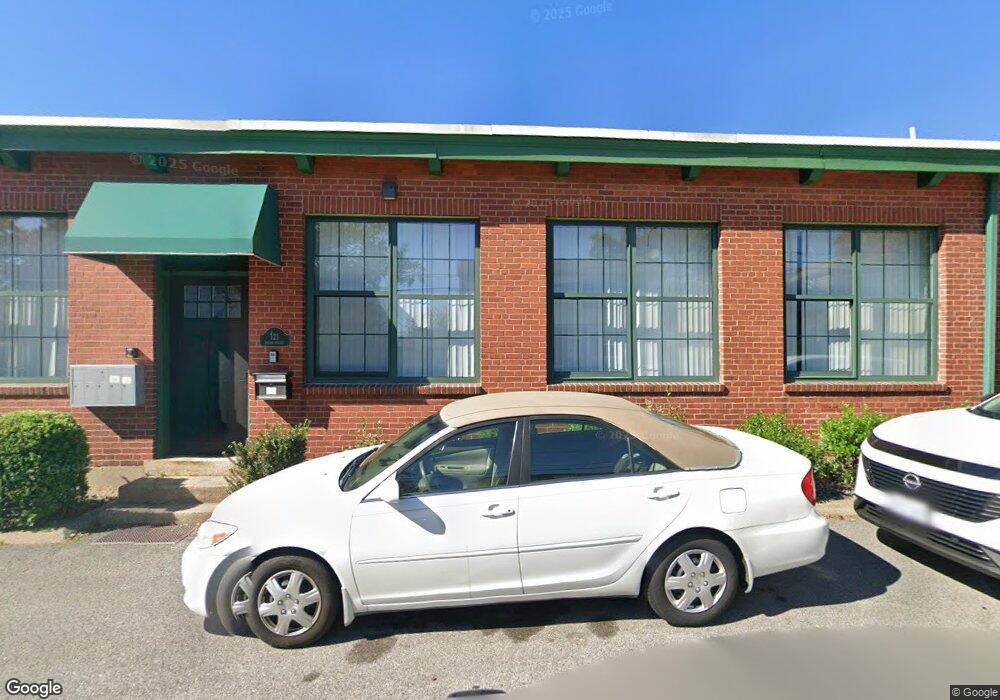
121 Bacon St Pawtucket, RI 02860
Beverage Hill-The Plains NeighborhoodEstimated Value: $752,310
Studio
--
Bath
6,000
Sq Ft
$125/Sq Ft
Est. Value
About This Home
This home is located at 121 Bacon St, Pawtucket, RI 02860 and is currently estimated at $752,310, approximately $125 per square foot. 121 Bacon St is a home located in Providence County with nearby schools including International Charter School, Saint Teresa Catholic Elementary School, and Saint Raphael Academy.
Ownership History
Date
Name
Owned For
Owner Type
Purchase Details
Closed on
Jun 26, 2025
Sold by
Svs Realty Llc
Bought by
Work Inc
Current Estimated Value
Purchase Details
Closed on
Oct 2, 2009
Sold by
John F Maguire Co Inc
Bought by
Svs Realty Llc
Home Financials for this Owner
Home Financials are based on the most recent Mortgage that was taken out on this home.
Original Mortgage
$164,000
Interest Rate
5.12%
Mortgage Type
Commercial
Create a Home Valuation Report for This Property
The Home Valuation Report is an in-depth analysis detailing your home's value as well as a comparison with similar homes in the area
Home Values in the Area
Average Home Value in this Area
Purchase History
| Date | Buyer | Sale Price | Title Company |
|---|---|---|---|
| Work Inc | $770,000 | None Available | |
| Work Inc | $770,000 | None Available | |
| Svs Realty Llc | $205,000 | -- | |
| Svs Realty Llc | $205,000 | -- |
Source: Public Records
Mortgage History
| Date | Status | Borrower | Loan Amount |
|---|---|---|---|
| Previous Owner | Svs Realty Llc | $164,000 |
Source: Public Records
Tax History
| Year | Tax Paid | Tax Assessment Tax Assessment Total Assessment is a certain percentage of the fair market value that is determined by local assessors to be the total taxable value of land and additions on the property. | Land | Improvement |
|---|---|---|---|---|
| 2025 | $7,759 | $337,200 | $91,200 | $246,000 |
| 2024 | $7,284 | $337,200 | $91,200 | $246,000 |
| 2023 | $8,904 | $300,300 | $75,700 | $224,600 |
| 2022 | $8,715 | $300,300 | $75,700 | $224,600 |
| 2021 | $8,715 | $300,300 | $75,700 | $224,600 |
| 2020 | $9,252 | $268,400 | $75,700 | $192,700 |
| 2019 | $9,252 | $268,400 | $75,700 | $192,700 |
| 2018 | $8,914 | $268,400 | $75,700 | $192,700 |
| 2017 | $8,940 | $256,300 | $75,700 | $180,600 |
| 2016 | $8,597 | $255,800 | $75,700 | $180,100 |
| 2015 | $8,597 | $255,800 | $75,700 | $180,100 |
| 2014 | $8,242 | $266,900 | $82,300 | $184,600 |
Source: Public Records
Map
Nearby Homes
Your Personal Tour Guide
Ask me questions while you tour the home.