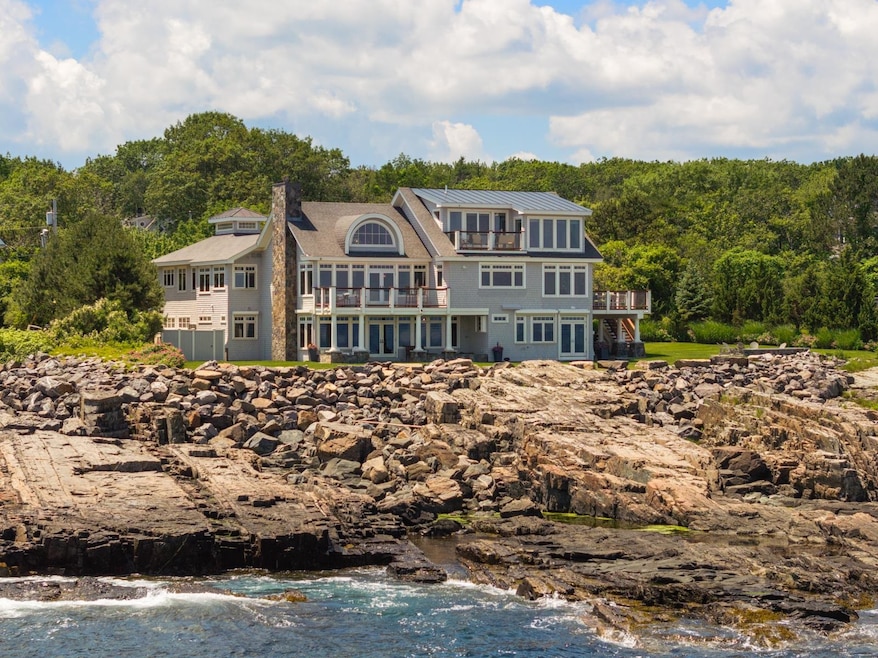
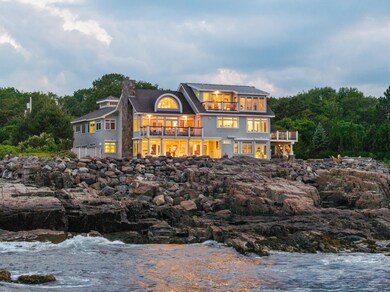
121 Bald Head Cliff Rd Cape Neddick, ME 03902
Estimated payment $33,893/month
Highlights
- Waterfront
- Deck
- Cathedral Ceiling
- Horace Mitchell Primary School Rated A-
- Radiant Floor
- Modern Architecture
About This Home
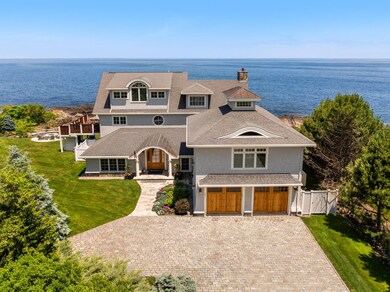
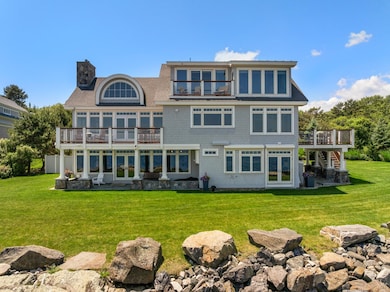
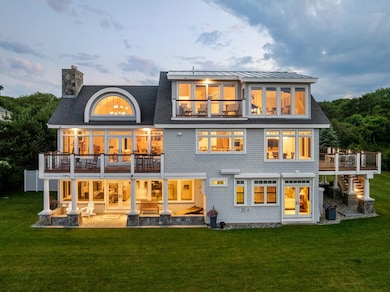
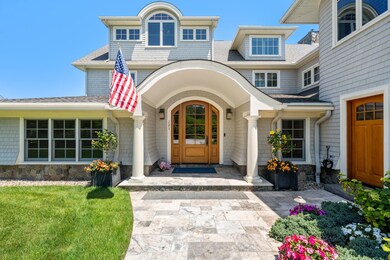
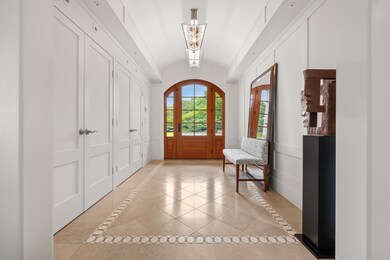
Perched on the bold Atlantic coastline on one of Maine's most coveted stretches of shore, 121 Bald Head Cliff Road offers a rare blend of luxury, privacy, and breathtaking views. This stunning 4-bedroom, 6,000+ square foot shingle-style residence is a masterclass in design and craftsmanship, blending timeless architectural appeal with state-of-the-art smart home technology. From the moment you enter, expansive ocean views command your attention. Walls of glass frame breathtaking ocean views throughout the home, while cathedral ceilings and expansive, light-filled living areas create a sense of openness and tranquility. A Crestron smart home system controls exterior lighting, audio and climate control, while a custom sound system enhances both interior and exterior spaces—perfect for everyday living or entertaining on any scale. An elevator thoughtfully connects all levels of the home. The third floor, a secluded primary suite offers a serene escape with a private oceanfront balcony, spa-inspired bath, and his and her closets. Each of the three additional bedrooms is en-suite, including a private guest suite with sitting room and office—ideal for visitors or multi-generational living. A wine connoisseur's dream, the first level features a temperature-controlled wine room, perfect for showcasing your collection. Just steps away, a private home gym offers a convenient space to stay active without leaving the comfort of home.
Listing Agent
Anchor Real Estate
Anchor Real Estate Listed on: 09/04/2025
Home Details
Home Type
- Single Family
Est. Annual Taxes
- $30,392
Year Built
- Built in 2008
Lot Details
- 0.78 Acre Lot
- Waterfront
- Property fronts a private road
- Irrigation Equipment
- Garden
- Property is zoned Res=2
Parking
- 2 Car Direct Access Garage
- Automatic Garage Door Opener
- Driveway
- Off-Street Parking
- Unassigned Parking
Home Design
- Modern Architecture
- Metal Roof
- Wood Siding
- Shingle Siding
Interior Spaces
- 6,525 Sq Ft Home
- Property has 3 Levels
- Wet Bar
- Bar
- Woodwork
- Cathedral Ceiling
- Natural Light
- Blinds
- Family Room
- Combination Dining and Living Room
- Den
- Home Gym
- Water Views
Kitchen
- Microwave
- ENERGY STAR Qualified Dishwasher
- Wine Cooler
- Kitchen Island
Flooring
- Wood
- Radiant Floor
- Tile
Bedrooms and Bathrooms
- 4 Bedrooms
- En-Suite Primary Bedroom
- En-Suite Bathroom
- Walk-In Closet
Laundry
- ENERGY STAR Qualified Dryer
- ENERGY STAR Qualified Washer
Outdoor Features
- Water Access
- Nearby Water Access
- Property is near an ocean
- Balcony
- Deck
Utilities
- Forced Air Heating and Cooling System
- Radiant Heating System
- Programmable Thermostat
- Underground Utilities
- Private Water Source
- Well
- Septic Design Available
Listing and Financial Details
- Tax Lot 22
- Assessor Parcel Number 4
Map
Home Values in the Area
Average Home Value in this Area
Tax History
| Year | Tax Paid | Tax Assessment Tax Assessment Total Assessment is a certain percentage of the fair market value that is determined by local assessors to be the total taxable value of land and additions on the property. | Land | Improvement |
|---|---|---|---|---|
| 2024 | $30,392 | $3,618,100 | $1,871,900 | $1,746,200 |
| 2023 | $31,093 | $3,679,600 | $1,871,900 | $1,807,700 |
| 2022 | $30,481 | $3,565,000 | $1,895,000 | $1,670,000 |
| 2021 | $30,026 | $3,017,700 | $1,603,500 | $1,414,200 |
| 2020 | $28,500 | $2,567,600 | $1,399,400 | $1,168,200 |
| 2019 | $28,629 | $2,567,600 | $1,399,400 | $1,168,200 |
| 2018 | $14,414 | $2,561,800 | $1,341,100 | $1,220,700 |
| 2017 | $26,324 | $2,404,000 | $1,370,300 | $1,033,700 |
| 2016 | $26,805 | $2,404,000 | $1,370,300 | $1,033,700 |
| 2015 | $25,802 | $2,345,600 | $1,311,900 | $1,033,700 |
| 2014 | $25,098 | $2,345,600 | $1,311,900 | $1,033,700 |
| 2013 | $24,698 | $2,368,000 | $1,311,900 | $1,056,100 |
Property History
| Date | Event | Price | List to Sale | Price per Sq Ft | Prior Sale |
|---|---|---|---|---|---|
| 10/06/2025 10/06/25 | Sold | $5,900,000 | -0.8% | $904 / Sq Ft | View Prior Sale |
| 09/03/2025 09/03/25 | For Sale | $5,950,000 | 0.0% | $912 / Sq Ft | |
| 07/11/2025 07/11/25 | Pending | -- | -- | -- | |
| 07/08/2025 07/08/25 | For Sale | $5,950,000 | -- | $912 / Sq Ft |
Purchase History
| Date | Type | Sale Price | Title Company |
|---|---|---|---|
| Deed | $5,900,000 | -- | |
| Warranty Deed | -- | None Available | |
| Warranty Deed | -- | None Available | |
| Foreclosure Deed | $1,325,000 | -- | |
| Foreclosure Deed | $1,325,000 | -- | |
| Foreclosure Deed | $1,325,000 | -- | |
| Foreclosure Deed | -- | -- | |
| Foreclosure Deed | -- | -- | |
| Foreclosure Deed | -- | -- | |
| Personal Reps Deed | -- | -- | |
| Personal Reps Deed | -- | -- |
Mortgage History
| Date | Status | Loan Amount | Loan Type |
|---|---|---|---|
| Open | $4,000,000 | New Conventional | |
| Previous Owner | $300,000 | Unknown | |
| Previous Owner | $1,325,000 | Purchase Money Mortgage |
Source: PrimeMLS
MLS Number: 5059683
APN: YORK-000004-000000-000022
Disclaimer: Certain information contained herein is derived from information provided by parties other than Homes.com. All information provided is deemed reliable, but is not guaranteed to be accurate and should be independently verified.
![]() Copyright 2025 PrimeMLS, Inc. All rights reserved. This information is deemed reliable, but not guaranteed. The data relating to real estate displayed on this display comes in part from the IDX Program of PrimeMLS. The information being provided is for consumers’ personal, non-commercial use and may not be used for any purpose other than to identify prospective properties consumers may be interested in purchasing.
Copyright 2025 PrimeMLS, Inc. All rights reserved. This information is deemed reliable, but not guaranteed. The data relating to real estate displayed on this display comes in part from the IDX Program of PrimeMLS. The information being provided is for consumers’ personal, non-commercial use and may not be used for any purpose other than to identify prospective properties consumers may be interested in purchasing.
- 32 Regency Cir Unit 2
- 7 Fernald Rd
- 7 Blackberry Place
- 58 Cutts Rd
- 24 Regency Cir Unit 3
- 122 Haley Rd
- 8 Caslyn Dr
- 100 Shepards Cove Rd Unit F204
- 100 Shepards Cove Rd Unit G204
- 49 Huntington Way
- 10 Lewis Rd
- 49 Betty Welch Rd
- 197 State Rd
- 46 Littlebrook Ln
- 178 Haley Rd Unit 2
- 3 Sandalwood Cir
- 20 Colony Way
- 14 Colony Way
- 10 Colony Way
- 8 Colony Way
- 11 Dana Ave Unit Apartment 1
- 436 U S Rte 1
- 26-3 Regency Cir
- 100 Shepards Cove Rd Unit B2
- 38 Levesque Dr
- 41 Seacoast Terrace
- 17 Page St
- 9 Jean St
- 324 Main St
- 955 Main St Unit 1
- 3 Walker St
- 79 Porpoise Way
- 4 Stimson St
- 34 Mendum Ave
- 648 Kearsarge Way Unit 648
- 258 Raleigh Way Unit Atlantic Heights 285 Raleigh Way
- 5 Pleasant St Unit A
- 148 Whipple Rd
- 146 Spinnaker Way
- 99 Spinnaker Way