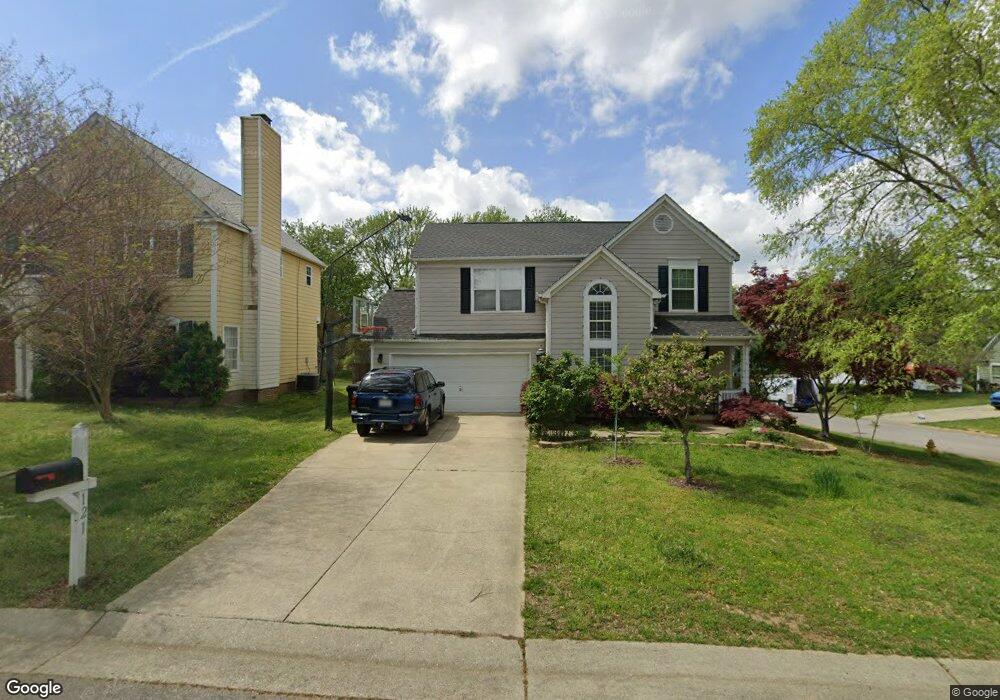
121 Bracken Trail Cir Holly Springs, NC 27540
Estimated Value: $383,000 - $421,000
3
Beds
3
Baths
1,655
Sq Ft
$241/Sq Ft
Est. Value
About This Home
This home is located at 121 Bracken Trail Cir, Holly Springs, NC 27540 and is currently estimated at $398,695, approximately $240 per square foot. 121 Bracken Trail Cir is a home located in Wake County with nearby schools including Oakview Elementary School, Apex Friendship Middle School, and Holly Springs High School.
Ownership History
Date
Name
Owned For
Owner Type
Purchase Details
Closed on
Aug 20, 2009
Sold by
Johnson Jeffrey P and Johnson Jeffrrey P
Bought by
Johnson Kimberly C
Current Estimated Value
Purchase Details
Closed on
Dec 30, 1999
Sold by
Lee David E
Bought by
Johnson Jeffrey P and Johnson Kimberly C
Home Financials for this Owner
Home Financials are based on the most recent Mortgage that was taken out on this home.
Original Mortgage
$136,375
Outstanding Balance
$42,808
Interest Rate
7.68%
Mortgage Type
FHA
Estimated Equity
$355,887
Purchase Details
Closed on
Apr 16, 1997
Sold by
Heidebrecht Elizabeth A
Bought by
Lee David E and Lee Barbara Burruss
Home Financials for this Owner
Home Financials are based on the most recent Mortgage that was taken out on this home.
Original Mortgage
$117,450
Interest Rate
7.31%
Create a Home Valuation Report for This Property
The Home Valuation Report is an in-depth analysis detailing your home's value as well as a comparison with similar homes in the area
Home Values in the Area
Average Home Value in this Area
Purchase History
| Date | Buyer | Sale Price | Title Company |
|---|---|---|---|
| Johnson Kimberly C | -- | Chicago Title Insurance Co | |
| Johnson Jeffrey P | $137,500 | -- | |
| Lee David E | $130,500 | -- |
Source: Public Records
Mortgage History
| Date | Status | Borrower | Loan Amount |
|---|---|---|---|
| Open | Johnson Jeffrey P | $136,375 | |
| Previous Owner | Lee David E | $117,450 |
Source: Public Records
Tax History Compared to Growth
Tax History
| Year | Tax Paid | Tax Assessment Tax Assessment Total Assessment is a certain percentage of the fair market value that is determined by local assessors to be the total taxable value of land and additions on the property. | Land | Improvement |
|---|---|---|---|---|
| 2025 | $3,212 | $370,890 | $115,000 | $255,890 |
| 2024 | $3,199 | $370,890 | $115,000 | $255,890 |
| 2023 | $2,645 | $243,415 | $50,000 | $193,415 |
| 2022 | $2,554 | $243,415 | $50,000 | $193,415 |
| 2021 | $2,507 | $243,415 | $50,000 | $193,415 |
| 2020 | $2,507 | $243,415 | $50,000 | $193,415 |
| 2019 | $2,328 | $191,845 | $50,000 | $141,845 |
| 2018 | $2,105 | $191,845 | $50,000 | $141,845 |
| 2017 | $2,030 | $191,845 | $50,000 | $141,845 |
| 2016 | $2,002 | $191,845 | $50,000 | $141,845 |
| 2015 | $1,811 | $170,638 | $35,000 | $135,638 |
| 2014 | -- | $170,638 | $35,000 | $135,638 |
Source: Public Records
Map
Nearby Homes
- 713 Littleleaf Ct
- 725 Little Leaf Ct
- 717 Starkland Way
- 105 Townsgate Ct
- 108 Crabwall Ct
- 109 Bright Shade Ct
- 329 N Main St
- 321 Blalock St
- 318 Blalock St
- 737 W Holly Springs Rd
- 225 Douglas St
- 743 W Holly Springs Rd
- 749 W Holly Springs Rd
- 124 Cliffdale Rd
- 755 W Holly Springs Rd
- 761 W Holly Springs Rd
- 112 Burt St
- 105 Cross Hill Ln
- 321 Cross Hill Ln
- 112 Sanchez Ct
- 117 Bracken Trail Cir
- 113 Bracken Trail Cir
- 804 Silverstone Way
- 800 Silverstone Way
- 109 Bracken Trail Cir
- 808 Silverstone Way
- 120 Bracken Trail Cir
- 116 Bracken Trail Cir
- 900 Silverstone Way
- 112 Bracken Trail Cir
- 405 Oakhall Dr
- 700 Little Leaf Ct
- 105 Bracken Trail Cir
- 409 Oakhall Dr
- 108 Bracken Trail Cir
- 904 Silverstone Way
- 804 Chambord Way
- 800 Chambord Way
- 917 Starkland Way
- 913 Starkland Way