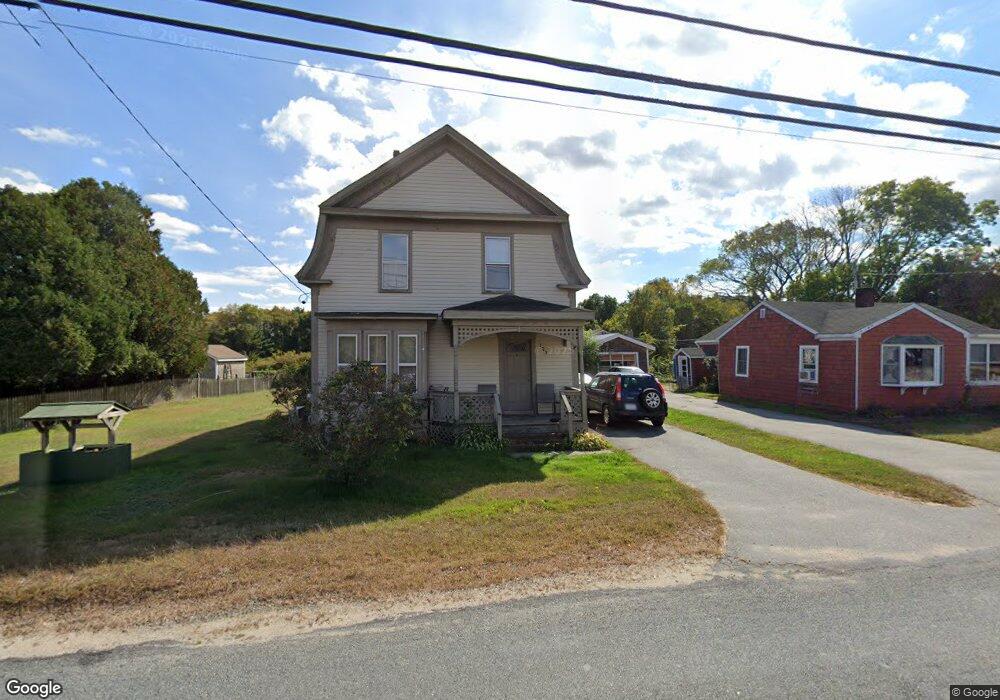
121 Chace Rd East Freetown, MA 02717
Estimated Value: $387,929 - $502,000
2
Beds
1
Bath
1,408
Sq Ft
$323/Sq Ft
Est. Value
About This Home
This home is located at 121 Chace Rd, East Freetown, MA 02717 and is currently estimated at $455,482, approximately $323 per square foot. 121 Chace Rd is a home located in Bristol County with nearby schools including Freetown Elementary School, George R Austin Intermediate School, and Freetown-Lakeville Middle School.
Ownership History
Date
Name
Owned For
Owner Type
Purchase Details
Closed on
May 29, 2007
Sold by
Wilbur Howard E and Wilbur Luella F
Bought by
Wilbur Ft and Wilbur Bruce W
Current Estimated Value
Purchase Details
Closed on
Oct 1, 1997
Sold by
Lyons Timothy
Bought by
Wilbur Luella F and Wilbur Howard E
Home Financials for this Owner
Home Financials are based on the most recent Mortgage that was taken out on this home.
Original Mortgage
$67,485
Interest Rate
7.41%
Mortgage Type
Purchase Money Mortgage
Create a Home Valuation Report for This Property
The Home Valuation Report is an in-depth analysis detailing your home's value as well as a comparison with similar homes in the area
Home Values in the Area
Average Home Value in this Area
Purchase History
| Date | Buyer | Sale Price | Title Company |
|---|---|---|---|
| Wilbur Ft | -- | -- | |
| Wilbur Luella F | $70,000 | -- |
Source: Public Records
Mortgage History
| Date | Status | Borrower | Loan Amount |
|---|---|---|---|
| Previous Owner | Wilbur Luella F | $67,485 | |
| Previous Owner | Wilbur Luella F | $35,000 |
Source: Public Records
Tax History Compared to Growth
Tax History
| Year | Tax Paid | Tax Assessment Tax Assessment Total Assessment is a certain percentage of the fair market value that is determined by local assessors to be the total taxable value of land and additions on the property. | Land | Improvement |
|---|---|---|---|---|
| 2025 | $3,399 | $343,000 | $153,700 | $189,300 |
| 2024 | $3,375 | $323,600 | $144,900 | $178,700 |
| 2023 | $3,256 | $304,000 | $130,500 | $173,500 |
| 2022 | $3,103 | $257,300 | $110,600 | $146,700 |
| 2021 | $2,974 | $234,200 | $100,500 | $133,700 |
| 2020 | $2,919 | $224,200 | $96,700 | $127,500 |
| 2019 | $2,696 | $205,000 | $92,100 | $112,900 |
| 2018 | $2,512 | $188,700 | $92,100 | $96,600 |
| 2017 | $2,454 | $184,200 | $92,100 | $92,100 |
| 2016 | $2,249 | $171,800 | $89,500 | $82,300 |
| 2015 | $2,192 | $169,900 | $89,500 | $80,400 |
| 2014 | $2,132 | $169,100 | $87,600 | $81,500 |
Source: Public Records
Map
Nearby Homes
- 144 Chace Rd
- 0 Costa Dr
- 195 Slab Bridge Rd
- 24 Bells Brook Rd
- 599 Quanapoag Rd
- 150 Quanapoag Rd
- Lot 2/3 Quanapoag Rd
- 9 Paul Ave
- 1475 Braley Rd Unit 17
- 4597 Acushnet Ave
- 13 Luscomb Ln
- 7 Great Cedar Crossing
- 16 Swallow St
- 5 Freetown St
- 1069 Cherokee St
- 319 Northwest St
- 15 Morrison Way
- 269 Middleboro Rd
- 34 Poplar Rd
- 210 Heritage Dr