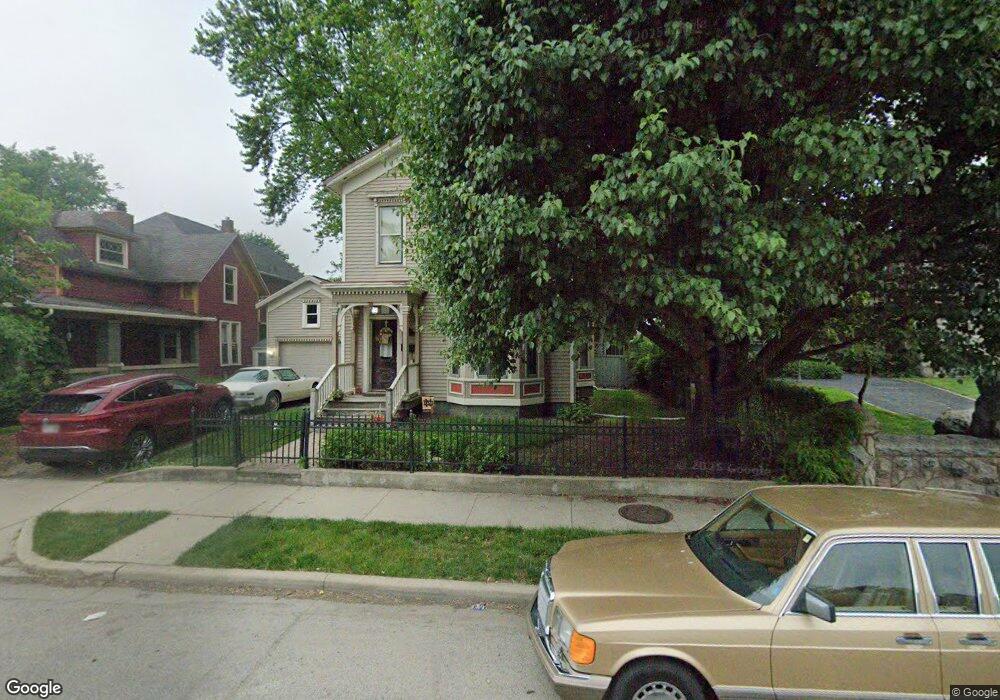
121 Chapin St South Bend, IN 46601
West Washington NeighborhoodEstimated Value: $123,000 - $243,000
3
Beds
3
Baths
1,876
Sq Ft
$96/Sq Ft
Est. Value
About This Home
This home is located at 121 Chapin St, South Bend, IN 46601 and is currently estimated at $179,249, approximately $95 per square foot. 121 Chapin St is a home located in St. Joseph County with nearby schools including Clay Intermediate Center, Marshall Traditional School, and Madison STEAM Academy.
Ownership History
Date
Name
Owned For
Owner Type
Purchase Details
Closed on
Sep 29, 2011
Sold by
South Bend Heritage Foundation Inc
Bought by
Ujdak Andrew D
Current Estimated Value
Home Financials for this Owner
Home Financials are based on the most recent Mortgage that was taken out on this home.
Original Mortgage
$76,100
Outstanding Balance
$52,003
Interest Rate
4.14%
Mortgage Type
New Conventional
Estimated Equity
$127,246
Purchase Details
Closed on
Jul 26, 2010
Sold by
Wells Fargo Bank Na
Bought by
South Bend Heritage Foundation
Purchase Details
Closed on
Jul 17, 2008
Sold by
Williams Thmas S and Williams Diane M
Bought by
Wells Fargo Bank
Purchase Details
Closed on
Apr 5, 2006
Sold by
Strauss Terri A
Bought by
Williams Thomas S and Williams Daine M
Home Financials for this Owner
Home Financials are based on the most recent Mortgage that was taken out on this home.
Original Mortgage
$117,450
Interest Rate
8.87%
Mortgage Type
Adjustable Rate Mortgage/ARM
Create a Home Valuation Report for This Property
The Home Valuation Report is an in-depth analysis detailing your home's value as well as a comparison with similar homes in the area
Home Values in the Area
Average Home Value in this Area
Purchase History
| Date | Buyer | Sale Price | Title Company |
|---|---|---|---|
| Ujdak Andrew D | -- | Metropolitan Title In Llc | |
| South Bend Heritage Foundation | $55,000 | Resource Title Agency Of Cin | |
| Wells Fargo Bank | $93,500 | None Available | |
| Williams Thomas S | -- | None Available | |
| Williams Thomas A | -- | None Available |
Source: Public Records
Mortgage History
| Date | Status | Borrower | Loan Amount |
|---|---|---|---|
| Open | Ujdak Andrew D | $76,100 | |
| Previous Owner | Williams Thomas A | $117,450 |
Source: Public Records
Tax History Compared to Growth
Tax History
| Year | Tax Paid | Tax Assessment Tax Assessment Total Assessment is a certain percentage of the fair market value that is determined by local assessors to be the total taxable value of land and additions on the property. | Land | Improvement |
|---|---|---|---|---|
| 2024 | $1,410 | $117,500 | $13,200 | $104,300 |
| 2023 | $1,367 | $120,100 | $13,200 | $106,900 |
| 2022 | $1,384 | $120,100 | $13,200 | $106,900 |
| 2021 | $1,005 | $86,600 | $5,200 | $81,400 |
| 2020 | $1,009 | $86,900 | $5,200 | $81,700 |
| 2019 | $694 | $65,100 | $3,900 | $61,200 |
| 2018 | $620 | $56,500 | $3,400 | $53,100 |
| 2017 | $630 | $56,000 | $3,400 | $52,600 |
| 2016 | $672 | $58,500 | $3,400 | $55,100 |
| 2014 | $630 | $57,800 | $3,400 | $54,400 |
Source: Public Records
Map
Nearby Homes
- 210 Chapin St
- 718 W Jefferson Blvd
- 839 & 841 W Colfax St Unit 2 family dwelling ho
- 839 W Colfax Ave Unit 841
- 918 W Lasalle Ave
- 509 W Jefferson Blvd
- 132 N Lafayette Blvd
- 141 N Walnut St
- 1311 Liston St
- 414 N William St
- 213 N Walnut St
- 0.3 Acres W Marion St
- 121 Studebaker St
- 611 Blaine Ave
- 524 Euclid Ave
- 322 Studebaker St
- 529 Euclid Ave
- 317 Studebaker St
- 418 Studebaker St
- 1209 Poplar St
- 125 Chapin St
- 127 Chapin St
- 131 Chapin St
- 128 Chapin St
- 114 Chapin St
- 132 Chapin St
- 136 Chapin St
- 744 W Washington St
- 202 Chapin St
- 730 W Washington St
- 731 W Jefferson Blvd
- 210 Chapin St Unit 212
- 121 Garfield Ct
- 115 Garfield Ct
- 113 Garfield Ct
- 727 W Jefferson Blvd
- 726 W Washington St
- 725 W Jefferson Blvd
- 724 W Washington St
- 120 Laurel St