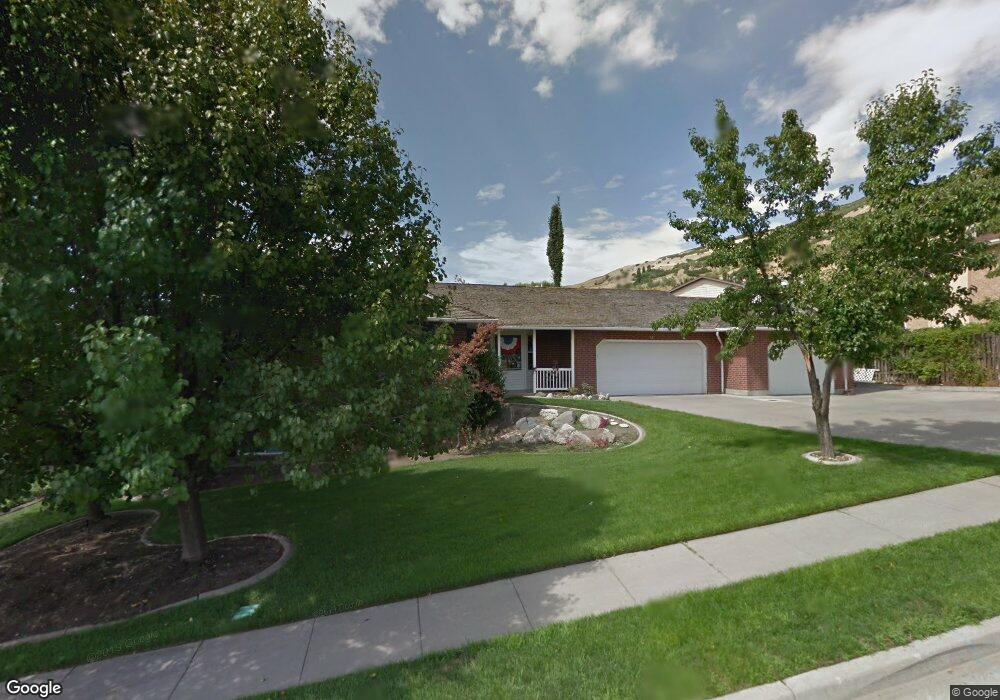
121 E 1900 N Centerville, UT 84014
Estimated Value: $611,000 - $816,000
5
Beds
3
Baths
4,230
Sq Ft
$175/Sq Ft
Est. Value
About This Home
This home is located at 121 E 1900 N, Centerville, UT 84014 and is currently estimated at $738,960, approximately $174 per square foot. 121 E 1900 N is a home located in Davis County with nearby schools including Reading School, Centerville Jr High, and Viewmont High School.
Ownership History
Date
Name
Owned For
Owner Type
Purchase Details
Closed on
Nov 21, 2011
Sold by
Jackman David
Bought by
Jackman David W and Jackman Mary E
Current Estimated Value
Home Financials for this Owner
Home Financials are based on the most recent Mortgage that was taken out on this home.
Original Mortgage
$252,000
Outstanding Balance
$170,590
Interest Rate
3.87%
Mortgage Type
Credit Line Revolving
Estimated Equity
$568,370
Purchase Details
Closed on
Feb 1, 2006
Sold by
Farmer Elaine R and Farmer Kelly N
Bought by
Farmer Kelly Lee
Purchase Details
Closed on
Oct 18, 2005
Sold by
Bank Of Utah
Bought by
Farmer Elaine R and Farmer Kelly N
Purchase Details
Closed on
Jul 13, 2005
Sold by
Farmer Elaine R and Farmer Kelly N
Bought by
Farmer Kelly Lee
Purchase Details
Closed on
Oct 24, 1995
Sold by
Bank One Utah National Assn
Bought by
Bank Of Utah
Create a Home Valuation Report for This Property
The Home Valuation Report is an in-depth analysis detailing your home's value as well as a comparison with similar homes in the area
Purchase History
| Date | Buyer | Sale Price | Title Company |
|---|---|---|---|
| Jackman David W | -- | Bonneville Superior | |
| Jackman David | -- | Advanced Title Ins A | |
| Farmer Kelly Lee | -- | None Available | |
| Farmer Elaine R | -- | -- | |
| Farmer Kelly Lee | -- | -- | |
| Bank Of Utah | -- | Weber Title Company |
Source: Public Records
Mortgage History
| Date | Status | Borrower | Loan Amount |
|---|---|---|---|
| Open | Jackman David | $252,000 |
Source: Public Records
Tax History
| Year | Tax Paid | Tax Assessment Tax Assessment Total Assessment is a certain percentage of the fair market value that is determined by local assessors to be the total taxable value of land and additions on the property. | Land | Improvement |
|---|---|---|---|---|
| 2025 | $4,414 | $397,100 | $175,411 | $221,689 |
| 2024 | $4,160 | $382,250 | $160,670 | $221,580 |
| 2023 | $3,926 | $655,000 | $259,598 | $395,402 |
| 2022 | $4,338 | $388,300 | $131,885 | $256,415 |
| 2021 | $3,692 | $530,000 | $205,786 | $324,214 |
| 2020 | $3,359 | $481,000 | $198,732 | $282,268 |
| 2019 | $3,376 | $475,000 | $191,763 | $283,237 |
| 2018 | $3,114 | $434,000 | $177,537 | $256,463 |
| 2016 | $2,643 | $206,085 | $63,828 | $142,257 |
| 2015 | $2,615 | $193,270 | $63,828 | $129,442 |
| 2014 | $2,350 | $178,148 | $63,828 | $114,320 |
| 2013 | -- | $128,560 | $45,707 | $82,853 |
Source: Public Records
Map
Nearby Homes
- 1893 N 100 E
- 63 W 1750 N
- 5 W Summerhill Ln
- 136 W Summerhill Ln
- 283 W Summerhill Ln
- 286 W Summerhill Ln
- 586 W 1950 N
- 354 S 525 W
- 393 S 525 W
- 374 S 525 W
- 373 S 525 W
- 386 S 525 W
- 461 W Summerhill Ln
- 551 W Summerhill Ln
- 687 W 2025 N
- 145 Ford Canyon Dr
- 1549 N 400 W
- 2132 N 725 W
- 2136 N 725 W
- 1692 Willow Creek Cir
Your Personal Tour Guide
Ask me questions while you tour the home.