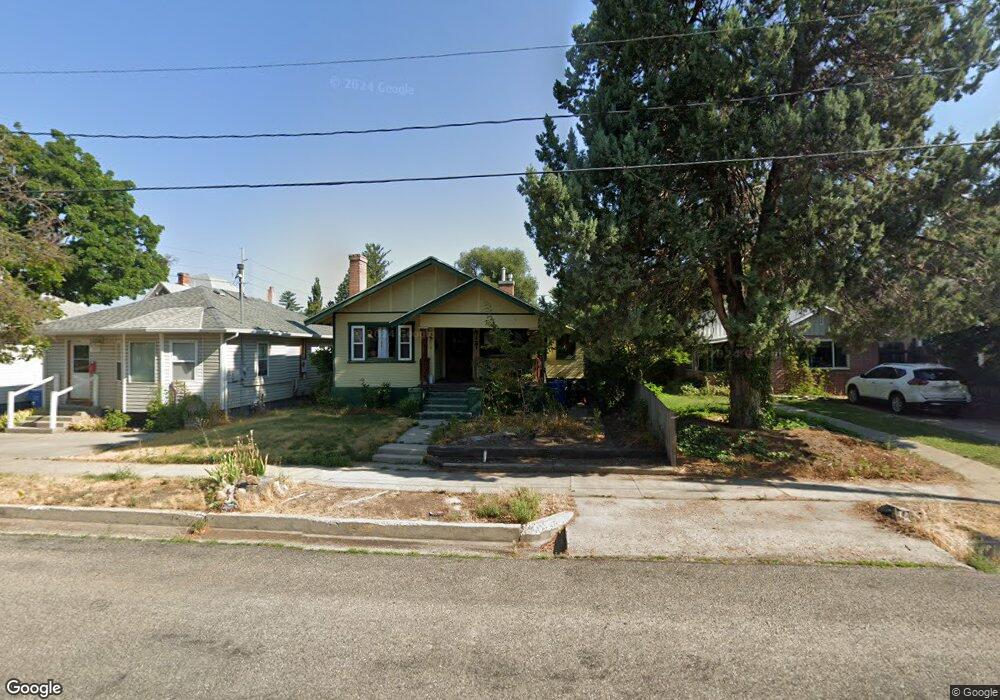
121 E 200 S Logan, UT 84321
Wilson NeighborhoodEstimated Value: $281,000 - $330,000
2
Beds
1
Bath
1,547
Sq Ft
$202/Sq Ft
Est. Value
About This Home
This home is located at 121 E 200 S, Logan, UT 84321 and is currently estimated at $311,818, approximately $201 per square foot. 121 E 200 S is a home located in Cache County with nearby schools including Wilson School, Mount Logan Middle School, and Logan High School.
Ownership History
Date
Name
Owned For
Owner Type
Purchase Details
Closed on
Jul 1, 2020
Sold by
Ostergar Darcia
Bought by
Ostergar Julia Bright
Current Estimated Value
Home Financials for this Owner
Home Financials are based on the most recent Mortgage that was taken out on this home.
Original Mortgage
$153,700
Outstanding Balance
$135,942
Interest Rate
3.2%
Mortgage Type
New Conventional
Estimated Equity
$175,876
Purchase Details
Closed on
Feb 6, 2019
Sold by
Kadlec Mark John and Estate Of David B Kadlec
Bought by
Ostergar Julia Bright and Ostergar Darca
Home Financials for this Owner
Home Financials are based on the most recent Mortgage that was taken out on this home.
Original Mortgage
$130,590
Interest Rate
4.5%
Mortgage Type
New Conventional
Purchase Details
Closed on
Oct 3, 2011
Sold by
Kadlec Bernice
Bought by
Kadlec David B
Purchase Details
Closed on
Sep 8, 2008
Sold by
Kadlec Properties Llc
Bought by
Kadlec L Bernice
Create a Home Valuation Report for This Property
The Home Valuation Report is an in-depth analysis detailing your home's value as well as a comparison with similar homes in the area
Home Values in the Area
Average Home Value in this Area
Purchase History
| Date | Buyer | Sale Price | Title Company |
|---|---|---|---|
| Ostergar Julia Bright | -- | American Secure Title Logan | |
| Ostergar Julia Bright | -- | American Secure Title Logan | |
| Kadlec David B | -- | None Available | |
| Kadlec L Bernice | -- | None Available |
Source: Public Records
Mortgage History
| Date | Status | Borrower | Loan Amount |
|---|---|---|---|
| Open | Ostergar Julia Bright | $153,700 | |
| Closed | Ostergar Julia Bright | $130,590 |
Source: Public Records
Tax History
| Year | Tax Paid | Tax Assessment Tax Assessment Total Assessment is a certain percentage of the fair market value that is determined by local assessors to be the total taxable value of land and additions on the property. | Land | Improvement |
|---|---|---|---|---|
| 2025 | $1,316 | $170,265 | $0 | $0 |
| 2024 | $1,353 | $169,520 | $0 | $0 |
| 2023 | $1,423 | $169,925 | $0 | $0 |
| 2022 | $1,079 | $120,270 | $0 | $0 |
| 2021 | $98 | $169,051 | $45,000 | $124,051 |
| 2020 | $906 | $140,424 | $45,000 | $95,424 |
| 2019 | $947 | $140,424 | $45,000 | $95,424 |
| 2018 | $961 | $130,200 | $45,000 | $85,200 |
| 2017 | $914 | $65,450 | $0 | $0 |
| 2016 | $948 | $65,450 | $0 | $0 |
| 2015 | $949 | $65,450 | $0 | $0 |
| 2014 | $858 | $65,450 | $0 | $0 |
| 2013 | -- | $65,450 | $0 | $0 |
Source: Public Records
Map
Nearby Homes
Your Personal Tour Guide
Ask me questions while you tour the home.