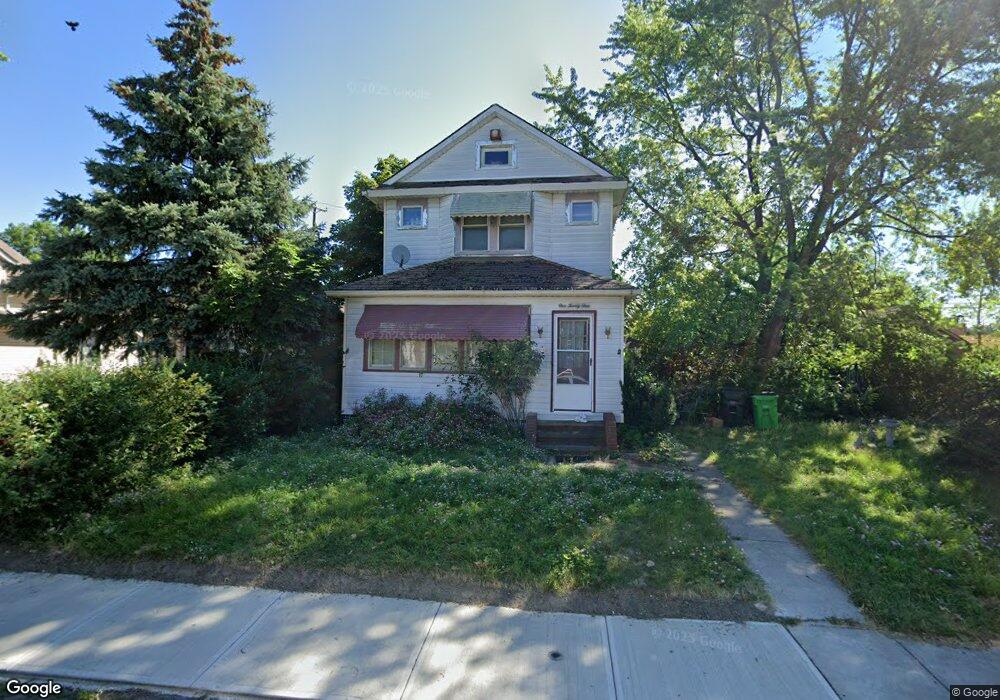
121 E 220th St Euclid, OH 44123
Estimated Value: $141,534 - $162,000
3
Beds
1
Bath
1,096
Sq Ft
$140/Sq Ft
Est. Value
About This Home
This home is located at 121 E 220th St, Euclid, OH 44123 and is currently estimated at $153,134, approximately $139 per square foot. 121 E 220th St is a home located in Cuyahoga County with nearby schools including Bluestone Elementary School, Euclid High School, and Pinnacle Academy.
Ownership History
Date
Name
Owned For
Owner Type
Purchase Details
Closed on
Jan 26, 2000
Sold by
Rastetter Gregory A
Bought by
Passmore Donna M
Current Estimated Value
Home Financials for this Owner
Home Financials are based on the most recent Mortgage that was taken out on this home.
Original Mortgage
$86,288
Outstanding Balance
$27,857
Interest Rate
7.84%
Estimated Equity
$125,277
Purchase Details
Closed on
Nov 20, 1994
Sold by
Kary Lawrence J
Bought by
Rastetter Gregory A
Home Financials for this Owner
Home Financials are based on the most recent Mortgage that was taken out on this home.
Original Mortgage
$67,900
Interest Rate
8.91%
Mortgage Type
FHA
Purchase Details
Closed on
May 6, 1976
Sold by
Granito Anthony J and Granito Ruth A
Bought by
Kary Lawrence J
Purchase Details
Closed on
Jan 1, 1975
Bought by
Granito Anthony J and Granito Ruth A
Create a Home Valuation Report for This Property
The Home Valuation Report is an in-depth analysis detailing your home's value as well as a comparison with similar homes in the area
Home Values in the Area
Average Home Value in this Area
Purchase History
| Date | Buyer | Sale Price | Title Company |
|---|---|---|---|
| Passmore Donna M | $87,000 | Reliance Title | |
| Rastetter Gregory A | $72,000 | -- | |
| Kary Lawrence J | $31,200 | -- | |
| Granito Anthony J | -- | -- |
Source: Public Records
Mortgage History
| Date | Status | Borrower | Loan Amount |
|---|---|---|---|
| Open | Passmore Donna M | $86,288 | |
| Previous Owner | Rastetter Gregory A | $67,900 |
Source: Public Records
Tax History
| Year | Tax Paid | Tax Assessment Tax Assessment Total Assessment is a certain percentage of the fair market value that is determined by local assessors to be the total taxable value of land and additions on the property. | Land | Improvement |
|---|---|---|---|---|
| 2024 | $3,390 | $47,075 | $12,670 | $34,405 |
| 2023 | $3,017 | $33,110 | $7,070 | $26,040 |
| 2022 | $2,952 | $33,110 | $7,070 | $26,040 |
| 2021 | $3,274 | $33,110 | $7,070 | $26,040 |
| 2020 | $3,168 | $30,660 | $6,550 | $24,120 |
| 2019 | $2,850 | $87,600 | $18,700 | $68,900 |
| 2018 | $2,851 | $30,660 | $6,550 | $24,120 |
| 2017 | $3,064 | $27,300 | $6,370 | $20,930 |
| 2016 | $3,071 | $27,300 | $6,370 | $20,930 |
| 2015 | $2,794 | $27,300 | $6,370 | $20,930 |
| 2014 | $2,794 | $27,300 | $6,370 | $20,930 |
Source: Public Records
Map
Nearby Homes
- 104 E 219th St
- 170 E 220th St
- 226 E 216th St
- 55 Sunnycliff Dr
- 461 Kenwood Dr Unit T3
- 450 Kenwood Dr Unit E12
- 421 Kenwood Dr Unit G
- 23198 Gay St
- 470 Kenwood Dr Unit D
- 324 E 215th St
- 490 Kenwood Dr Unit B
- 22751 Fox Ave
- 144 E 208th St
- 324 E 235th St
- 422 Clearview Dr Unit J10
- 323 E 235th St
- 303 E 235th St
- 334 E 238th St
- 22301 Milton Dr
- 273 E 208th St
Your Personal Tour Guide
Ask me questions while you tour the home.