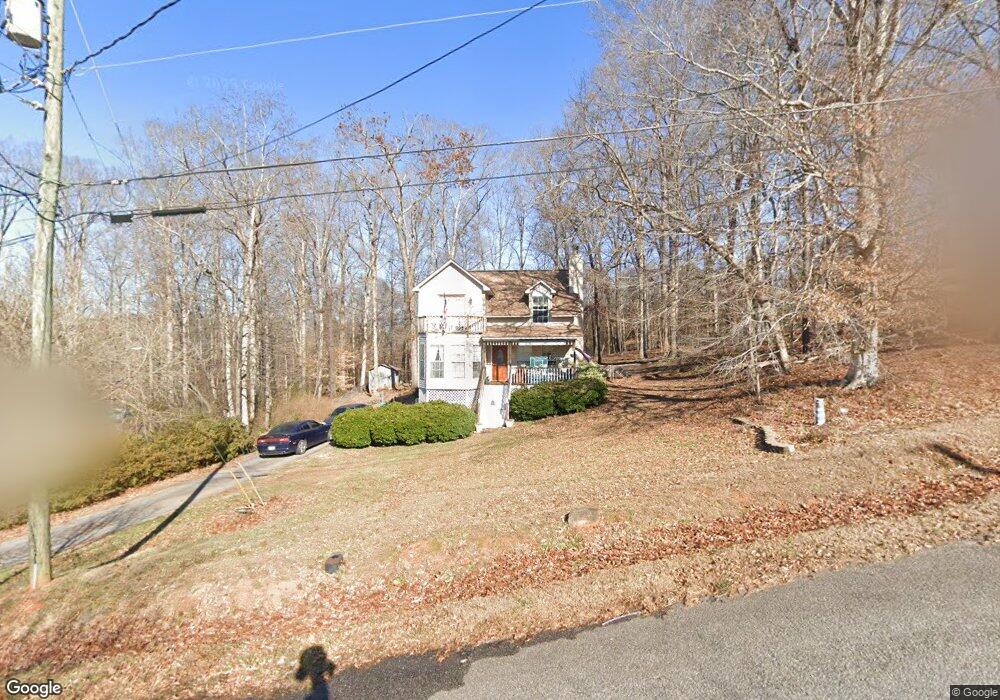
121 E Carolina St Duncan, SC 29334
Estimated Value: $181,000 - $260,000
3
Beds
2
Baths
1,326
Sq Ft
$166/Sq Ft
Est. Value
About This Home
This home is located at 121 E Carolina St, Duncan, SC 29334 and is currently estimated at $220,057, approximately $165 per square foot. 121 E Carolina St is a home located in Spartanburg County with nearby schools including Duncan Elementary School, Byrnes Freshman Academy, and Beech Springs Intermediate School.
Ownership History
Date
Name
Owned For
Owner Type
Purchase Details
Closed on
Jul 11, 2022
Sold by
Scott Hawkins Jeffrey
Bought by
Murwin William A
Current Estimated Value
Home Financials for this Owner
Home Financials are based on the most recent Mortgage that was taken out on this home.
Original Mortgage
$165,938
Outstanding Balance
$157,885
Interest Rate
5.1%
Mortgage Type
FHA
Estimated Equity
$62,172
Purchase Details
Closed on
Jan 14, 2020
Sold by
Hawkins Amber and Hawkins Scott
Bought by
Hawkins Jeffrey Scott and Hawkins Amber
Purchase Details
Closed on
Feb 28, 2007
Sold by
Pesta Andrew and Pesta Heidi A
Bought by
Hawkins Amber and Hawkins Scott
Home Financials for this Owner
Home Financials are based on the most recent Mortgage that was taken out on this home.
Original Mortgage
$122,600
Interest Rate
6.3%
Mortgage Type
Unknown
Purchase Details
Closed on
Nov 13, 2001
Sold by
Pesta Andrew C
Bought by
Pesta Heidi A
Create a Home Valuation Report for This Property
The Home Valuation Report is an in-depth analysis detailing your home's value as well as a comparison with similar homes in the area
Home Values in the Area
Average Home Value in this Area
Purchase History
| Date | Buyer | Sale Price | Title Company |
|---|---|---|---|
| Murwin William A | $169,000 | None Listed On Document | |
| Murwin William A | $169,000 | None Listed On Document | |
| Hawkins Jeffrey Scott | -- | Equity Settlement Svcs Inc | |
| Hawkins Amber | $122,600 | None Available | |
| Pesta Heidi A | -- | -- |
Source: Public Records
Mortgage History
| Date | Status | Borrower | Loan Amount |
|---|---|---|---|
| Open | Murwin William A | $165,938 | |
| Closed | Murwin William A | $165,938 | |
| Previous Owner | Hawkins Amber | $122,600 |
Source: Public Records
Tax History
| Year | Tax Paid | Tax Assessment Tax Assessment Total Assessment is a certain percentage of the fair market value that is determined by local assessors to be the total taxable value of land and additions on the property. | Land | Improvement |
|---|---|---|---|---|
| 2022 | $1,237 | $5,193 | $572 | $4,621 |
| 2021 | $3,444 | $5,193 | $572 | $4,621 |
| 2020 | $1,199 | $5,193 | $572 | $4,621 |
| 2019 | $1,189 | $5,193 | $572 | $4,621 |
| 2018 | $1,129 | $5,193 | $572 | $4,621 |
| 2017 | $1,015 | $4,516 | $600 | $3,916 |
| 2016 | $982 | $4,516 | $600 | $3,916 |
| 2015 | $962 | $4,516 | $600 | $3,916 |
| 2014 | $954 | $4,516 | $600 | $3,916 |
Source: Public Records
Map
Nearby Homes
- 100 Holly Dr
- 290 Forest Lake Rd
- 296 Forest Lake Rd
- 128 Lyman Ave
- 124 Lyman Ave
- 120 Lyman Ave
- 179 Rosewood Cir
- 224 Hotchkiss Ln
- 26 Little St
- 116 Johnson St
- 0 S Danzler Rd Unit 7362340
- 102 Kalkora Ct
- 3 Pacific St
- 5 Pacific St
- 1117 Syrah Ln
- 1212 N Pinot Rd
- 1321 S Pinot Rd
- 1313 S Pinot Rd
- 1325 S Pinot Rd
- 000 S Church St
- 117 E Carolina St
- 120 Springdale St
- 111 W Carolina St
- 115 E Carolina St
- 116 W Carolina St
- 110 E Carolina St
- 118 Springdale St
- 109 W Carolina St
- 114 W Carolina St
- 108 E Carolina St
- 115 Springdale St
- 107 W Carolina St
- 111 E Carolina St
- 113 Springdale St
- 112 W Carolina St
- 106 E Carolina St
- 109 E Carolina St
- 105 W Carolina St
- 111 Springdale St
- 110 W Carolina St
Your Personal Tour Guide
Ask me questions while you tour the home.