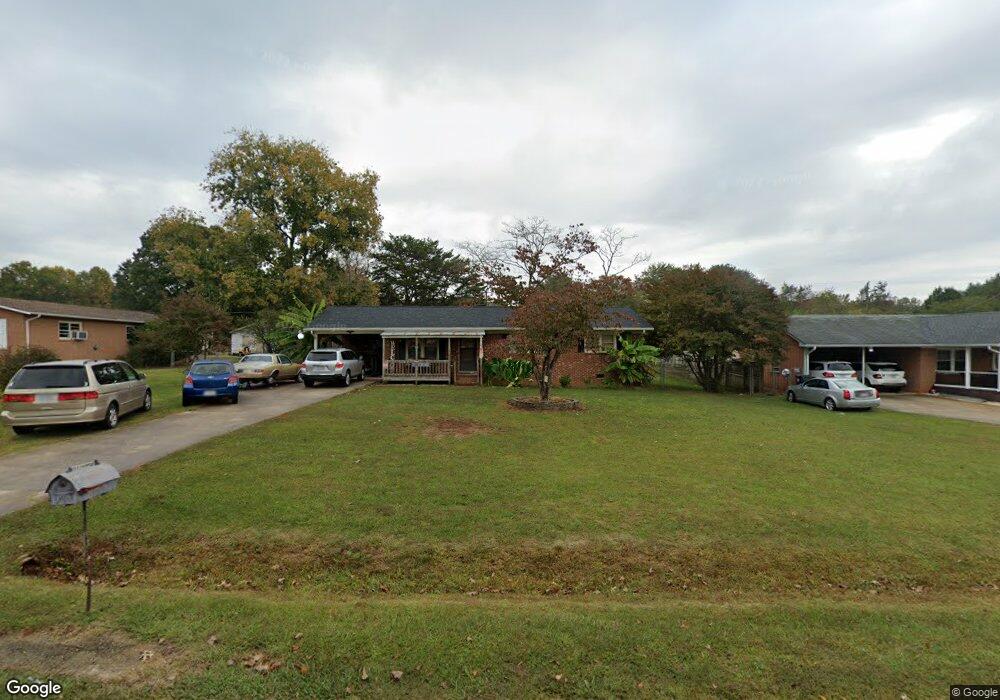
121 E Chamblee Dr Salisbury, NC 28147
Estimated Value: $229,000 - $256,000
3
Beds
1
Bath
1,175
Sq Ft
$203/Sq Ft
Est. Value
About This Home
This home is located at 121 E Chamblee Dr, Salisbury, NC 28147 and is currently estimated at $238,589, approximately $203 per square foot. 121 E Chamblee Dr is a home located in Rowan County with nearby schools including Knollwood Elementary School, Southeast Middle School, and West Rowan High School.
Ownership History
Date
Name
Owned For
Owner Type
Purchase Details
Closed on
Jun 21, 2019
Sold by
Taffaro Kenneth V
Bought by
Nava Jose Vega and Vega Amanda Sarai
Current Estimated Value
Home Financials for this Owner
Home Financials are based on the most recent Mortgage that was taken out on this home.
Original Mortgage
$125,000
Outstanding Balance
$109,906
Interest Rate
4.1%
Mortgage Type
New Conventional
Estimated Equity
$128,683
Purchase Details
Closed on
Mar 1, 2019
Sold by
Roscoe Tina M and Showfety June E
Bought by
Taffaro Kenneth V
Home Financials for this Owner
Home Financials are based on the most recent Mortgage that was taken out on this home.
Original Mortgage
$26,511
Interest Rate
4.4%
Mortgage Type
Purchase Money Mortgage
Purchase Details
Closed on
Apr 1, 1979
Bought by
Roscoe Judy W
Create a Home Valuation Report for This Property
The Home Valuation Report is an in-depth analysis detailing your home's value as well as a comparison with similar homes in the area
Purchase History
| Date | Buyer | Sale Price | Title Company |
|---|---|---|---|
| Nava Jose Vega | $125,000 | Southlake Title | |
| Taffaro Kenneth V | $72,000 | None Available | |
| Roscoe Judy W | $28,500 | -- |
Source: Public Records
Mortgage History
| Date | Status | Borrower | Loan Amount |
|---|---|---|---|
| Open | Nava Jose Vega | $125,000 | |
| Previous Owner | Taffaro Kenneth V | $26,511 |
Source: Public Records
Tax History
| Year | Tax Paid | Tax Assessment Tax Assessment Total Assessment is a certain percentage of the fair market value that is determined by local assessors to be the total taxable value of land and additions on the property. | Land | Improvement |
|---|---|---|---|---|
| 2025 | $1,001 | $147,688 | $28,000 | $119,688 |
| 2024 | $1,001 | $147,688 | $28,000 | $119,688 |
| 2023 | $1,001 | $147,688 | $28,000 | $119,688 |
| 2022 | $690 | $91,324 | $21,500 | $69,824 |
| 2021 | $683 | $91,324 | $21,500 | $69,824 |
| 2020 | $683 | $91,324 | $21,500 | $69,824 |
| 2019 | $671 | $89,810 | $21,500 | $68,310 |
| 2018 | $580 | $78,191 | $21,500 | $56,691 |
| 2017 | $580 | $78,191 | $21,500 | $56,691 |
| 2016 | $290 | $78,191 | $21,500 | $56,691 |
| 2015 | $293 | $78,191 | $21,500 | $56,691 |
| 2014 | $285 | $79,833 | $20,500 | $59,333 |
Source: Public Records
Map
Nearby Homes
- 206 Cedar Dr
- 114 Cedar Dr
- 1120 Joy St
- 112 Cedar Dr
- 140 Overbrook Rd
- 1300 Briarwood Terrace
- 2885 Wright Ave
- 116 Stoneybrook Rd
- 335 Bonaventure Dr
- 325 Bonaventure Dr
- 225 Roger Dr
- 1050 Gibson Rd
- 1030 Gibson Rd
- 240 Partridge Run
- 201 Bayberry Dr
- 0 Mooresville Rd Unit CAR4356691
- 1015 Quail Cir
- 4710 Mooresville Rd
- 4712 Mooresville Rd
- 325 Bob White Run
- 131 E Chamblee Dr
- 111 E Chamblee Dr
- 141 E Chamblee Dr
- 101 E Chamblee Dr
- 110 E Chamblee Dr
- 120 E Chamblee Dr
- 151 E Chamblee Dr
- 130 E Chamblee Dr
- 309 Hickory Ln
- 2206 Airport Rd
- 2302 Airport Rd
- 2202 Airport Rd
- 307 Hickory Ln
- 2304 Airport Rd
- 161 E Chamblee Dr
- 301 Hickory Ln
- 150 E Chamblee Dr
- 2306 Airport Rd
- 311 Hickory Ln
- 105 Hickory Ln
Your Personal Tour Guide
Ask me questions while you tour the home.