Estimated Value: $97,756 - $163,000
3
Beds
1
Bath
984
Sq Ft
$131/Sq Ft
Est. Value
About This Home
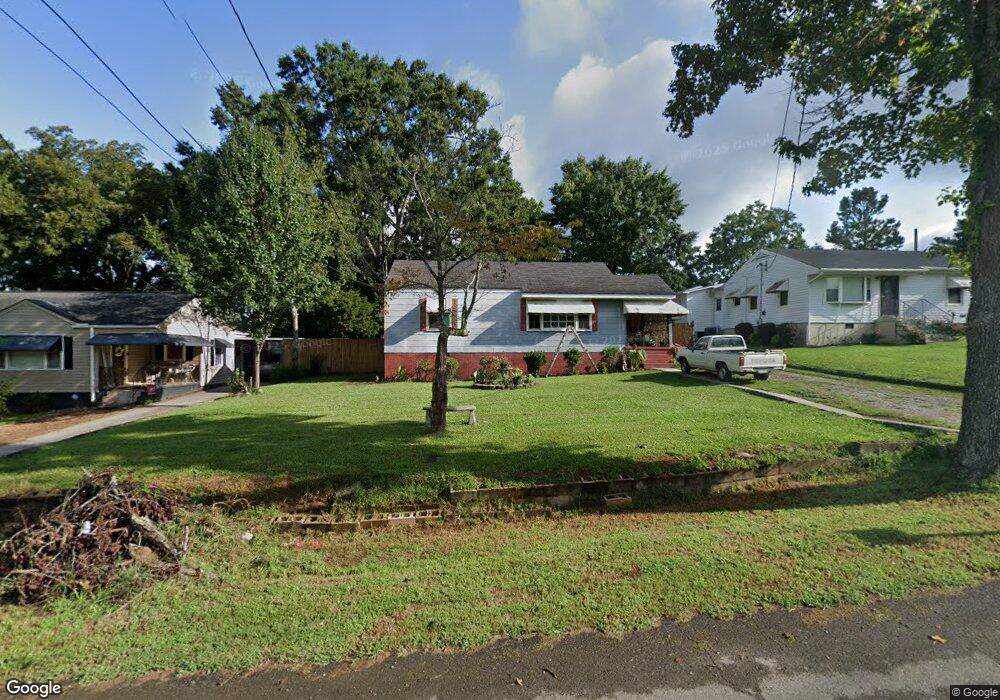
This home is located at 121 E Juniper Way SE, Rome, GA 30161 and is currently estimated at $128,689, approximately $130 per square foot. 121 E Juniper Way SE is a home located in Floyd County with nearby schools including Pepperell Middle School, Pepperell High School, and Montessori School of Rome.
Ownership History
Date
Name
Owned For
Owner Type
Purchase Details
Closed on
Sep 21, 2012
Sold by
Young David Lamar
Bought by
Young David Lamar and Young Gregory Lee
Current Estimated Value
Purchase Details
Closed on
May 23, 2001
Sold by
Young Gordon L and Opal Lambert Young
Bought by
Young David Lamar
Purchase Details
Closed on
Jan 18, 1994
Sold by
Young Gordon L
Bought by
Young Gordon L and Opal Lambert Young
Purchase Details
Closed on
Dec 10, 1990
Sold by
Young David
Bought by
Young Gordon L
Purchase Details
Closed on
Jul 28, 1988
Sold by
Young Gordon Lee and Young Opal
Bought by
Young David
Purchase Details
Closed on
Mar 25, 1982
Sold by
Lambert Nettie Est
Bought by
Young Gordon Lee and Young Opal
Purchase Details
Closed on
Jun 19, 1972
Sold by
Rogers F Wayne
Bought by
Lambert Nettie Est
Purchase Details
Closed on
Feb 7, 1964
Sold by
Sherman John W
Bought by
Rogers F Wayne
Purchase Details
Closed on
Jan 1, 1901
Bought by
Sherman John W
Create a Home Valuation Report for This Property
The Home Valuation Report is an in-depth analysis detailing your home's value as well as a comparison with similar homes in the area
Home Values in the Area
Average Home Value in this Area
Purchase History
| Date | Buyer | Sale Price | Title Company |
|---|---|---|---|
| Young David Lamar | -- | -- | |
| Young Opal Inez | -- | -- | |
| Young David Lamar | -- | -- | |
| Young Gordon L | -- | -- | |
| Young Gordon L | $17,200 | -- | |
| Young David | $22,500 | -- | |
| Young Gordon Lee | $18,000 | -- | |
| Lambert Nettie Est | $14,000 | -- | |
| Rogers F Wayne | $600 | -- | |
| Sherman John W | -- | -- |
Source: Public Records
Tax History
| Year | Tax Paid | Tax Assessment Tax Assessment Total Assessment is a certain percentage of the fair market value that is determined by local assessors to be the total taxable value of land and additions on the property. | Land | Improvement |
|---|---|---|---|---|
| 2025 | $931 | $30,857 | $4,620 | $26,237 |
| 2024 | $931 | $26,010 | $4,200 | $21,810 |
| 2023 | $791 | $24,488 | $3,600 | $20,888 |
| 2022 | $651 | $20,325 | $3,000 | $17,325 |
| 2021 | $164 | $18,132 | $3,000 | $15,132 |
| 2020 | $412 | $15,882 | $2,400 | $13,482 |
| 2019 | $365 | $13,947 | $2,400 | $11,547 |
| 2018 | $341 | $13,192 | $2,400 | $10,792 |
| 2017 | $393 | $20,132 | $2,400 | $17,732 |
| 2016 | $502 | $20,804 | $2,400 | $18,404 |
| 2015 | $498 | $20,804 | $2,400 | $18,404 |
| 2014 | $498 | $20,804 | $2,400 | $18,404 |
Source: Public Records
Map
Nearby Homes
- 7 Willingham St SW
- 2108 Maple Ave SW
- 2501 Maple Rd SE
- 118 Hosea St SW
- 2508 Maple Rd SE
- 111 Hosea St SW
- 2107 Rockmart Rd SE
- 2523 Maple Rd SE
- 0 Martha Berry Hwy Unit 7525627
- 0 Martha Berry Hwy Unit 7614774
- 0 Martha Berry Hwy Unit 10690106
- 0 Martha Berry Hwy Unit 10563404
- 2405 Rockmart Rd SE
- 27 Saddle Mountain Rd SE
- 2009 Hull Ave SW
- 212 Alfred Ave SE
- 407 E 19th St SW
- 304 E 19th St SW
- 26 Saddlebrook Dr SE
- 36 Saddle Mountain Rd SE
- 123 E Juniper Way SE
- 119 E Juniper Way SE
- 117 E Juniper Way SE
- 28 Lombardy Way SE
- 30 Lombardy Way SE
- 26 Lombardy Way SE
- 1 Rosemont Dr SE
- 120 E Juniper Way SE
- 2301 Flannery St SE
- 24 Lombardy Way SE
- 122 E Juniper Way SE
- 118 E Juniper Way SE
- 115 E Juniper Way SE
- 22 Lombardy Way SE
- 116 E Juniper Way SE
- 116 E Juniper Way SE
- 3 Rosemont Dr SE
- 116 E Juniper Way SE
- 2401 Flannery St SE
- 20 Lombardy Way SE
Your Personal Tour Guide
Ask me questions while you tour the home.